In brief · summary: Virginia
Virginia State Real Estate Market Review
Section 01Executive Summary
Virginia is a large and diverse state anchored by federal government, defense, technology, logistics, and services, with an economy that spans the Washington and Northern Virginia corridor, Hampton Roads, Richmond, and extensive mid sized and rural markets. Labor market data from the United States Bureau of Labor Statistics show that Virginia's statewide unemployment rate held between 3.7 and 3.8 percent from January through June 2026 on a seasonally adjusted basis, with a civilian labor force of 4,518.6 thousand people in January 2026 declining to 4,480.5 thousand people in June 2026 and total nonfarm employment slipping from 4,248.0 thousand to 4,243.7 thousand jobs over the same period. The twelve month change in total nonfarm employment as of June 2026 was a decline of 1.0 percent, indicating a modest contraction rather than rapid growth.
On the housing side, Redfin reports that in May 2026 the median sale price across all home types in Virginia was 453,389 dollars, up 3.0 percent from May 2025. Statewide there were 34,194 homes for sale in May 2026, an increase of 5.7 percent year over year, and 31.9 percent of Virginia homes sold above list price, a 0.01 percentage point increase from the prior year. For comparison, Redfin's United States overview shows that nationally the median sale price in May 2026 was 398,771 dollars, up 2.0 percent year over year, with 1,483,839 homes for sale, up 0.7 percent, and 24.9 percent of homes selling above list price, a 0.083 percentage point decrease. These figures place Virginia as a higher price, more competitive housing market than the nation overall, with inventory rising from tight levels but buyer competition still intense.
Population, income, rent, vacancy, and cap rate statistics at the state level are constrained by data access in this environment. The Census QuickFacts profile for Virginia is blocked by a Cloudflare security page, and the Census state population estimates file is truncated before the Virginia state row appears, so official figures such as total population, median household income, and statewide median gross rent cannot be cited. The federal fair market rent interface does not display dollar amounts in the accessible extract, and statewide apartment and commercial real estate vacancy and cap rate series are housed in proprietary datasets that are not open here. As a result, this review grounds its quantitative analysis primarily in Bureau of Labor Statistics labor data and Redfin housing metrics, with regional population context from the Census state estimates file and risk framing from FEMA and NOAA, while treating rents, vacancy, and cap rates qualitatively.
For accredited investors, Virginia offers a large, structurally important market tied to federal and defense spending, port and logistics activity, higher education, and health care, with a significant base of multifamily and single family housing and diverse commercial real estate. The combination of relatively high home prices, mild employment contraction, and rising inventory suggests a market transitioning from extreme tightness toward a more balanced posture, but with substantial variation across submarkets and asset classes.
Section 02Population and Migration
This environment does not provide a direct numeric population figure for Virginia. The Census Bureau's QuickFacts tool, which normally reports state population estimates and demographic characteristics, returns a Cloudflare blocking page for Virginia, and the Census state population estimates file for 2020 through 2025 is truncated before the Virginia state row appears. As a result, this review cannot state Virginia's 2020, 2024, or 2025 population counts or growth rates.
Regional context is available. The same Census state population estimates file shows that the South Atlantic census division, which includes Virginia along with Delaware, the District of Columbia, Florida, Georgia, Maryland, North Carolina, South Carolina, and West Virginia, had a population of 70,198,706 people in 2025. The South Atlantic division's population increased by 612,492 people between 2024 and 2025, and the file reports that in 2025 there were 726,922 births and 664,595 deaths in the division, for a natural increase of 62,327 people. Net migration into the South Atlantic division in 2025, combining domestic and international migration, was 553,456 people, consisting of 349,644 people of net international migration and 203,812 people of net domestic migration. These figures make clear that population growth in the South Atlantic region is dominated by in migration rather than by natural increase.
Redfin's national migration data add another perspective. Across the United States, 19 percent of homebuyers using Redfin's platform searched to move to a different metropolitan area between January 2026 and March 2026. During that period, the top five destination states for these platform users were Florida, Arizona, South Carolina, Tennessee, and Nevada, while California, New York, Illinois, Washington, and Massachusetts were the top five origin states. Virginia is not listed among the top destination or origin states in this migration snapshot, which is consistent with a pattern where Virginia participates in regional flows but is not among the extreme in migration or outmigration states at the national level.
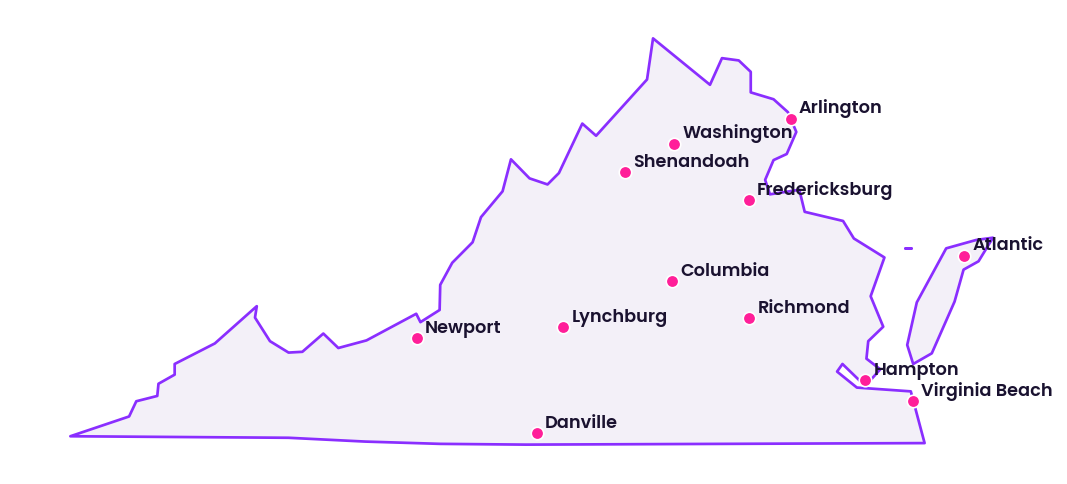
Qualitatively, Virginia's population is concentrated in Northern Virginia counties within the Washington Arlington Alexandria metropolitan area, the Hampton Roads region including Virginia Beach, Norfolk, and Newport News, the Richmond metropolitan area, and several mid sized metros such as Roanoke, Lynchburg, and the Shenandoah Valley corridor. Smaller cities and rural areas in Southwest and Southside Virginia have experienced slower growth or population loss in recent decades, while Northern Virginia has grown more quickly. Without official state population figures in this environment, investors should interpret demand through labor and housing metrics and property level evidence rather than relying on a single statewide population growth rate.
Section 03Jobs and Economic Anchors
Labor market data from the Bureau of Labor Statistics provide a detailed view of Virginia's employment base and trends. On a seasonally adjusted basis, Virginia's civilian labor force was 4,518.6 thousand people in January 2026 and declined to 4,480.5 thousand people by June 2026. Employment over the same period fell from 4,353.0 thousand to 4,312.6 thousand, while the number of unemployed persons rose slightly from 165.6 thousand in January to 168.0 thousand in June, after peaking near 171.9 thousand in the spring. The statewide unemployment rate was 3.7 percent in January 2026, ticked up to 3.8 percent from February through May, and returned to 3.7 percent in June 2026. Total nonfarm wage and salary employment was 4,248.0 thousand jobs in January 2026 and 4,243.7 thousand jobs in June 2026, with the twelve month percentage change in total nonfarm employment at a decline of 1.0 percent in June.
The table below summarizes these statewide labor metrics for the first half of 2026.
| Month 2026 | Civilian labor force (thousands) | Employment (thousands) | Unemployment rate (percent) | Total nonfarm employment (thousands) | Twelve month change in total nonfarm employment (percent) |
|---|---|---|---|---|---|
| January | 4,518.6 | 4,353.0 | 3.7% | 4,248.0 | -0.6% |
| February | 4,513.5 | 4,344.1 | 3.8% | 4,238.5 | -0.9% |
| March | 4,504.7 | 4,333.0 | 3.8% | 4,245.3 | -0.8% |
| April | 4,496.9 | 4,325.0 | 3.8% | 4,245.2 | -0.9% |
| May | 4,490.8 | 4,320.8 | 3.8% | 4,238.5 | -1.2% |
| June (preliminary) | 4,480.5 | 4,312.6 | 3.7% | 4,243.7 | -1.0% |
All values in this table are from the United States Bureau of Labor Statistics Virginia Economy at a Glance series, extracted August 7, 2026.
Sector level data show the composition of Virginia's economy and which industries are expanding or contracting. In June 2026, seasonally adjusted employment in mining and logging was 6.5 thousand jobs, with a twelve month change that was a decline of 4.4 percent, underscoring the small and declining role of extractive industries. Construction employed 226.6 thousand workers, with a twelve month change that was a decline of 2.0 percent, suggesting some cooling in construction activity. Manufacturing had 227.9 thousand jobs, down 4.2 percent over twelve months, indicating sustained headwinds in goods producing industries.
By contrast, service sectors dominate Virginia's employment base. Trade, transportation, and utilities accounted for 695.0 thousand jobs in June 2026, with a flat twelve month change of 0.0 percent. Professional and business services, a key Northern Virginia sector tied to federal contracting and corporate services, employed 788.5 thousand people but had a twelve month change that was a decline of 2.5 percent, reflecting contraction in higher wage office and technology related work. Education and health services employed 631.0 thousand people and still grew modestly, with a twelve month change of 0.7 percent. Leisure and hospitality, which captures tourism and hospitality activity in destinations such as Virginia Beach, Williamsburg, and the Shenandoah Valley, employed 420.7 thousand people, with a flat twelve month change of 0.0 percent. Government remained one of the largest sectors at 764.4 thousand jobs in June 2026, with a small twelve month decline of 0.1 percent.
These figures highlight a diversified economy anchored by professional and business services, government, education and health services, and trade and logistics. For real estate, Northern Virginia's proximity to Washington, federal agencies, and defense contractors underpins office, multifamily, and high amenity single family demand, even amid some contraction. The Hampton Roads port, naval installations, and tourism create demand for industrial, multifamily, and hospitality assets. Richmond's role as the state capital and regional financial and corporate center supports office and residential markets. The modest statewide employment contraction and flat job growth in several sectors suggest that aggressive growth assumptions should be tempered, but the scale and diversity of Virginia's job base are significant positives.
Section 04Income
Household and personal income levels are critical to understanding housing affordability and rent or price growth capacity, but this environment does not provide current numeric income data for Virginia. The Census Bureau's QuickFacts profile for Virginia, which would typically report median household income, per capita income, and poverty rates, is blocked by a Cloudflare security page. American Community Survey tabulations that contain detailed income distributions are not accessible here in a machine readable form, and Bureau of Economic Analysis state personal income tables are delivered through interactive tools that do not expose Virginia specific figures in the accessible extract.
Given these constraints, this review cannot state Virginia median household income, per capita income, or the distribution of households across income brackets. Qualitatively, Virginia combines high income areas in Northern Virginia, where many households work in federal, defense, and technology roles, with more moderate income communities in coastal, central, and rural regions. This diversity implies that affordability conditions and rent headroom vary widely by submarket.
For investors, the absence of statewide numeric income data underscores the need for property level and local market analysis. Underwriting should be based on actual tenant incomes where available, local wage scales, and submarket specific rent to income ratios, rather than on a single statewide median that is not observable in this environment.
Section 05Housing and Multifamily
Virginia's housing market is both large and competitive. Redfin's Virginia housing market overview reports that in May 2026, the median sale price across all home types in the state was 453,389 dollars, which represents a 3.0 percent increase compared with May 2025. In the same month, there were 34,194 homes for sale statewide, up 5.7 percent year over year, and 31.9 percent of homes sold above list price, a 0.01 percentage point increase from the prior year. These metrics reflect conditions across single family and multifamily properties that transact through the multiple listing service and public records.
For context, Redfin's United States housing overview shows that nationally in May 2026 the median sale price across all home types was 398,771 dollars, up 2.0 percent year over year, with 1,483,839 homes for sale, up 0.7 percent year over year. Nationally, 24.9 percent of homes sold above list price in May 2026, and that share declined by 0.083 percentage points from the prior year. The table below summarizes these statewide and national housing metrics.
| Geography | Month and year | Median sale price (dollars, all home types) | Year over year change in median price (percent) | Homes for sale (all home types) | Year over year change in homes for sale (percent) | Homes sold above list price (percent of sales) | Year over year change in share selling above list (percentage points, direction) |
|---|---|---|---|---|---|---|---|
| Virginia statewide | May 2026 | 453,389 | +3.0% | 34,194 | +5.7% | 31.9% | +0.01% |
| United States | May 2026 | 398,771 | +2.0% | 1,483,839 | +0.7% | 24.9% | -0.083% |
These data show that Virginia's median sale price is substantially higher than the national median and that prices in Virginia are rising slightly faster than the national average. The increase in homes for sale in Virginia is much larger in percentage terms than the national increase, suggesting that sellers are returning to the market and inventory is beginning to normalize from very tight conditions. Yet nearly one third of homes statewide still sell above list price, and that share is edging higher, indicating continued bidding pressure.
Within Virginia, price growth is uneven. Redfin's list of Virginia metros with the fastest growing sales prices shows that in the twelve months through May 2026, Fredericksburg recorded a 35.4 percent increase in median sale price, South Riding saw a 20.7 percent increase, Tuckahoe a 19.4 percent increase, Meadowbrook a 16.3 percent increase, and Lincolnia a 15.4 percent increase. Other high growth areas include Sterling with a 14.1 percent increase, Danville with a 12.8 percent increase, Laurel with an 11.8 percent increase, Oakton with an 11.0 percent increase, and Arlington with a 10.7 percent increase. These figures highlight that certain suburban and exurban submarkets, often near major employment corridors, are experiencing double digit annual price growth, while statewide averages are pulled down by slower growing or flat regions.
Virginia's multifamily stock is concentrated in dense urban and suburban nodes such as Arlington and Alexandria in Northern Virginia, Richmond, Norfolk and Virginia Beach, and select college towns. While there is no statewide public dataset in this environment that provides the number of multifamily units, average sale prices per unit, or the share of total housing stock that is multifamily, the combination of high home prices and strong competition for listings implies sustained demand for rental housing, particularly for households priced out of ownership in high demand submarkets.
For multifamily investors, the statewide picture suggests that Class A properties in top submarkets may face more competition from new supply and shifting demand, while Class B and Class C assets in job rich corridors may benefit from the affordability gap. However, the modest statewide employment contraction and variations in local economic conditions argue for careful submarket selection and conservative rent growth assumptions.
Section 06Rents
Rents are a central driver of multifamily and single family rental investment performance, but there is no accessible statewide numeric rent series for Virginia in this environment. The federal fair market rent documentation system, which would normally provide dollar values for benchmark rents by county and metropolitan area, presents only a two step interface where users select a state and then a county or metropolitan fair market rent area, and the accessible extract does not display any fair market rent amounts for Virginia. American Community Survey tabulations that usually report median gross rent and rent burden are not available here in a form that can be parsed for Virginia. Private data providers that track asking and effective rents and rent growth by market and asset class are not publicly accessible in this context.
Without these sources, this review cannot state Virginia's median monthly rent, recent rent growth rate, or rent to income ratios, and no official public information is available on these points in this environment. Qualitatively, rents are highest in Northern Virginia submarkets near Washington, particularly in Arlington, Alexandria, and parts of Fairfax and Loudoun counties, as well as in high amenity neighborhoods in Richmond and near the oceanfront in Virginia Beach. More moderate rents prevail in outer suburbs, smaller metros, and rural counties.
Investors should therefore base rent assumptions on direct evidence such as in place rent rolls, recent leases, and local market surveys rather than on a statewide average. Submarket level data from brokers, property managers, and private data providers, combined with on the ground knowledge of tenant demand and competition, will be essential for accurate underwriting.
Section 07Vacancy
Vacancy rates in apartments, single family rentals, and commercial properties govern the balance between demand and supply and influence achievable rents and pricing. In this environment, there is no public statewide vacancy series for Virginia that can be cited. The Census Bureau's housing vacancy and homeownership survey does not provide Virginia specific figures in the accessible extract, and proprietary datasets for apartment vacancy and commercial space occupancy are not open here.
As a result, this review cannot provide numeric vacancy rates for Virginia's multifamily, single family rental, office, industrial, or retail segments, and no official public information is available on this point in this environment. Conditions also vary widely, since multifamily vacancy in prime Northern Virginia submarkets may be materially different from vacancy in older properties in smaller cities, and office vacancy in downtown Richmond may not match that in suburban office parks.
For investors, this means that vacancy must be analyzed at the submarket and property level. Lease up histories, tenant rollover patterns, competing inventory, and specific location attributes are more informative than a hypothetical statewide vacancy figure that is not observable here. Underwriting should incorporate realistic downtime and leasing costs based on comparable properties and current leasing activity.
Section 08Supply Pipeline
New construction and renovation activity determine how quickly Virginia's housing stock and commercial inventory can respond to demand. In this environment, there is no statewide numeric dataset available that reports Virginia's annual residential building permits, multifamily unit starts, or square footage of new commercial space. Census building permits and construction surveys are not accessible here in a way that allows extraction of Virginia specific figures, and state or local housing reports from Virginia Housing do not present statewide permit counts or unit deliveries in the accessible extract.
One proxy for construction activity is employment in the construction sector. Bureau of Labor Statistics data show that Virginia's construction sector employed 227.0 thousand people in May 2026 and 226.6 thousand people in June 2026 on a seasonally adjusted basis, down from 227.5 thousand in January 2026. The twelve month percentage change in construction employment was a decline of 1.2 percent in May and a decline of 2.0 percent in June 2026. This modest decline suggests that construction activity has cooled somewhat over the past year, which is consistent with higher interest rates and tighter financing conditions.
For multifamily and single family developers, this implies that while construction is still ongoing across the state, the pace of new starts may be slowing, particularly in more marginal projects or higher cost developments. In high demand submarkets where land and entitlement constraints already limit building, a slower construction pace can support rent and price stability for existing assets. At the same time, projects already underway will add new supply, and investors need project specific information from local planning and permitting offices, which is beyond the scope of this statewide review.
Section 09Single Family Homes
Single family homes are the dominant housing type in Virginia and a key asset class for both owner occupants and investors. Redfin's statewide housing metrics, which cover all home types but are heavily influenced by single family transactions, show that in May 2026 the median sale price in Virginia was 453,389 dollars, up 3.0 percent from May 2025. This compares with a national median sale price of 398,771 dollars and a 2.0 percent national year over year price increase. The 5.7 percent increase in the number of homes for sale in Virginia, to 34,194 listings in May 2026, suggests that inventory is loosening.
Despite the increase in inventory, the market remains competitive. In May 2026, 31.9 percent of homes in Virginia sold above list price, and that share rose slightly compared with May 2025. Nationally, 24.9 percent of homes sold above list price in May 2026, and that share declined slightly over the year. This indicates that multiple offer situations and pricing above asking are more common in Virginia than in the country as a whole and that this dynamic is persisting.
Redfin's list of Virginia metros with the fastest growing sales prices illustrates the intensity of demand in specific submarkets. Fredericksburg's median sale price increased by 35.4 percent over the year through May 2026, and South Riding's increased by 20.7 percent, reflecting strong demand in exurban and suburban communities accessible to major job centers. Tuckahoe's 19.4 percent increase, Meadowbrook's 16.3 percent increase, and Lincolnia's 15.4 percent increase point to robust appreciation in established suburban areas near Richmond and Northern Virginia. For investors, these figures describe past appreciation in certain corridors, alongside escalating entry costs; they are historical and are not an indication of future results.
Single family rental investors must navigate both acquisition pricing and rental demand. The elevated median sale price and the high share of homes selling above list price mean that buying assets at a discount to intrinsic value can be challenging, especially in high growth submarkets. At the same time, high purchase prices and limited supply for would be owner occupants can support rental demand and justify quality renovations and professional management, particularly in neighborhoods with strong schools and employment access.
Section 10Commercial Real Estate and Retail Centers
Virginia's commercial real estate market spans office, industrial and logistics, and retail properties, with concentrations in Northern Virginia, Richmond, Hampton Roads, and key regional centers. In this environment, there is no public statewide dataset that provides current numeric vacancy rates, asking rents per square foot, absorption, or capitalization rates by property type, and proprietary brokerage and data provider series that track these metrics are not accessible. As a result, this section focuses on qualitative patterns grounded in the statewide employment data and the structure of the economy.
Office space in Virginia is heavily influenced by federal government and defense related demand in Northern Virginia, including Arlington, Alexandria, Fairfax, and Loudoun counties, and by state government and corporate demand in Richmond. The contraction in professional and business services employment, a twelve month decline of 2.5 percent as of June 2026, suggests some softening in office demand, particularly in sectors such as consulting, technology, and administrative services. Hybrid and remote work trends further pressure traditional office utilization. Investors in Virginia office assets must therefore focus on tenant quality, lease terms, and building competitiveness, particularly in older properties facing new supply or changing user preferences.
Industrial and logistics real estate benefit from Virginia's port and transportation infrastructure. Trade, transportation, and utilities employment of 695.0 thousand jobs in June 2026, with a flat twelve month change, reflects a substantial and steady base of activity in distribution, warehousing, and related services. The Hampton Roads ports, intermodal facilities, and proximity to East Coast shipping lanes, as well as distribution corridors through Central and Northern Virginia, underpin demand for warehouse and logistics facilities. While numeric vacancy and rent levels cannot be quoted here, industrial assets near major highways and the ports are likely to remain in demand, with performance sensitive to broad trade volumes and tenant credit quality.
Retail real estate in Virginia includes grocery anchored neighborhood centers, power centers, and urban mixed use projects, as well as smaller downtown storefronts and highway oriented retail strips. Employment in leisure and hospitality, at 420.7 thousand jobs in June 2026 with a flat twelve month change, indicates ongoing activity in restaurants, entertainment, and tourism, which supports certain retail segments. However, shifts in consumer spending and the growth of online commerce continue to pressure nonessential physical retail. Without statewide numeric data on retail vacancy or rents, investors must rely on property specific and trade area analyses to assess tenant mix, sales performance, and resilience.
Cap rates for commercial assets in Virginia depend on property type, location, tenant quality, and lease structures. In the absence of public statewide cap rate series, investors should infer yields from comparable sales, lender feedback, and local brokerage research, and they should anticipate that pricing may be tighter in core Northern Virginia and Richmond submarkets and wider in secondary and tertiary markets.
Section 11Transactions and Capital Markets
Transaction and capital markets conditions govern how easily investors can buy and sell properties and at what leverage and cost of capital. In this environment, there is no consolidated public dataset that reports statewide transaction volumes, average deal sizes, or capitalization rates by property type for Virginia. County level deed and recording data capture individual transactions, and brokerage research aggregates some information, but those series are not summarized numerically in accessible public files here.
Nationally, benchmark interest rates have been higher in 2025 and 2026 than in much of the prior decade, increasing borrowing costs for both residential and commercial real estate. While this review does not quote specific interest rate figures, the general environment is one of tighter credit, more conservative underwriting, and greater scrutiny of debt service coverage and sponsor strength. In a state like Virginia, where many assets are located in large and mid sized markets with meaningful institutional participation, this can translate into slower deal velocity and repricing, particularly for office assets and highly levered strategies.
For accredited investors, the implication is that capital structure and hold period assumptions must reflect higher debt costs and potentially lower leverage. Equity heavy transactions may be more common, and returns may hinge more on operational value creation than on rapid multiple expansion. The absence of public statewide transaction metrics reinforces the need to work closely with lenders and brokers for deal specific intelligence.
Section 12Taxes
Tax policy affects both operating cash flow and investment returns. The Virginia Department of Taxation describes its role in administering state tax laws, communicating with taxpayers, and providing updates on legislative changes. Recent items highlighted include new Virginia tax laws enacted in the 2026 session of the General Assembly, a statewide sales tax holiday during the first weekend of August 2026 for qualifying school supplies, clothing, hurricane and emergency preparedness items, and certain energy efficient products, and an update on changes to the linkage between Virginia Tax and Virginia Employment Commission business accounts.
The accessible materials do not provide numeric statewide effective property tax rates, income tax brackets, or sales tax rates, so no official public numeric information is available on those points in this environment. While Virginia has state level income and sales taxes and local property taxes administered at the county and city level, this review cannot quote specific rate values without appropriate public figures. Property tax burdens thus must be analyzed on a jurisdiction by jurisdiction basis using county or city rate tables and actual tax bills.
For investors, Virginia's tax environment includes both state and local components. Operating projections should account for potential changes in property assessments, local rates, and state level tax policy, especially in light of recent legislative activity. The presence of targeted tax holidays and incentives for energy efficient products suggests some policy emphasis on resilience and sustainability, which may influence demand for certain property improvements.
Section 13Insurance
Insurance costs and coverage terms are critical considerations for real estate in Virginia, given exposure to coastal storms, flooding, and other hazards. Insurance regulation in Virginia is handled by the State Corporation Commission through its Bureau of Insurance, but in this environment the public insurance page cannot be accessed reliably due to repeated redirects, and no statewide numeric data on insurance premiums, loss ratios, or coverage distributions are available through that channel.
Without official numeric series, this review cannot state typical homeowners or commercial property insurance premiums in Virginia, nor can it quantify recent changes in insurance costs, and no official public information is available on these points in this environment. Qualitatively, properties in coastal and tidal regions, such as parts of Hampton Roads and the Eastern Shore, may face higher wind and flood related insurance costs and more stringent underwriting standards, while inland properties are more exposed to risks such as severe thunderstorms, riverine flooding, and winter storms.
Investors should therefore treat insurance as a property specific line item requiring current quotes from insurers and brokers. Coverage for wind, flood, and business interruption may be particularly important, and lender requirements for coverage levels and deductibles will materially influence operating expenses and risk management strategies.
Section 14Landlord Tenant and Regulatory Environment
Virginia's landlord tenant framework is defined by state statutes and case law that address issues such as lease terms, habitability standards, notice periods, and eviction procedures. In this environment, there is no consolidated numeric dataset that quantifies eviction timelines, number of landlord tenant cases, or the share of units covered by specific regulatory programs. However, Virginia is generally considered a jurisdiction that balances tenant protections with landlord rights rather than imposing comprehensive statewide rent control for market rate housing.
There is no evidence in the accessible public materials of a statewide cap on annual rent increases akin to rent stabilization regimes in some other states. Localities may adopt specific ordinances for affordable housing, short term rental regulation, or tenant protections, but these are not summarized numerically here. For investors, the practical implication is that market rent properties in most Virginia jurisdictions can adjust rents in line with tenant demand and competitive conditions, subject to fair housing laws and any local requirements.
Given the complexity and local variation in housing regulation, investors should obtain legal counsel to review lease forms, security deposit handling practices, notice and cure provisions, and any local ordinances affecting their properties. Political and community sentiment around affordability and tenant protections should also be monitored, particularly in fast growing urban and suburban submarkets.
Section 15Infrastructure
Infrastructure quality influences property performance, particularly in a geographically varied state like Virginia. Roads and highways connect Northern Virginia to Washington, Richmond to Hampton Roads, and the Interstate 81 corridor through the Shenandoah Valley, while bridges, tunnels, ports, water and sewer systems, and energy infrastructure support both daily life and economic activity. In this environment, there is no statewide numeric dataset accessible that provides Virginia's total infrastructure spending, condition scores, or backlog of needed repairs.
Qualitatively, the presence of major interstate highways, the facilities of the Port of Virginia, and regional airports supports logistics and industrial real estate, while investments in transit and road improvements in Northern Virginia and the Richmond region influence residential and office demand patterns. In rural areas, limited infrastructure can constrain development, while in older urban cores aging systems may require upgrades.
For investors, infrastructure should be evaluated at the property and submarket level. Key questions include road access and congestion, public transit availability, reliability and capacity of water and sewer service, and the presence of any special assessments or improvement districts. Planned infrastructure projects can create opportunities in advance of completion but may also disrupt operations during construction.
Section 16Climate and Physical Risks
Virginia faces multiple climate and physical risks that are material for real estate. FEMA flood map guidance explains that floods can occur almost anywhere, including away from large bodies of water, and that flood maps identify areas with the highest risk. FEMA defines any location with at least a one percent annual chance of flooding as having high risk, and notes that such areas have at least a one in four chance of flooding during a thirty year mortgage period. Coastal and tidal communities in Virginia, as well as river valleys and low lying inland areas, fall into higher risk categories on FEMA flood maps.
The National Centers for Environmental Information maintains one of the world's most significant archives of environmental data, including atmospheric and hydrologic records, and provides access to climate, coastal, and geophysical data. While this review does not extract Virginia specific climate statistics from those archives, the broader record documents trends such as rising sea levels, more frequent heavy precipitation events, and heatwaves that can affect Virginia's coasts and interior.
Key physical risks for Virginia properties include coastal storm surge and tidal flooding in Hampton Roads and the Eastern Shore, riverine flooding along major rivers and tributaries, intense rainfall events that overwhelm drainage systems, and wind and ice damage from storms. Over time, climate change may increase the frequency and severity of certain hazards, affecting insurance costs, building code requirements, and tenant expectations around resilience.
Investors should integrate climate risk analysis into due diligence, including reviewing FEMA flood designations for each site, understanding elevation and drainage, and assessing building resilience features such as roof design, building envelope integrity, stormwater management systems, and backup power. Long term hold strategies should consider potential regulatory changes related to resilience and building performance.
Section 17Opportunities
Several opportunity themes emerge from Virginia's statewide real estate and multifamily landscape.
First, Virginia's large and diversified job base, with 4,243.7 thousand total nonfarm jobs in June 2026 and significant employment in professional and business services, government, education and health services, and trade and logistics, provides a broad foundation for housing and commercial demand. Even though total employment has declined modestly over the past year, the absolute scale and sector diversity reduce idiosyncratic risk tied to any single employer or industry.
Second, Virginia's housing market exhibits a price premium and strong buyer competition. A median sale price of 453,389 dollars in May 2026, roughly 55,000 dollars above the national median, combined with more than thirty percent of homes selling above list price, suggests that households are willing to pay for access to Virginia's job markets, schools, and amenities. For multifamily and single family rental investors, this dynamic can support rental demand and may justify quality improvements, particularly in high growth corridors such as Fredericksburg, South Riding, and other exurban and suburban submarkets that have experienced double digit annual price gains, though past price gains are not an indication of future results.
Third, Virginia's port and logistics infrastructure creates opportunities in industrial and logistics real estate. With 695.0 thousand jobs in trade, transportation, and utilities as of June 2026 and a flat twelve month change, the state benefits from steady demand for warehouse, distribution, and related facilities serving both domestic and international trade.
Fourth, the state's higher education and health care institutions support stable demand for student and workforce housing, medical office space, and related services. Education and health services employment of 631.0 thousand jobs in June 2026, with positive though moderating growth, underscores the scale of this anchor.
Section 18Risks
Investing in Virginia also involves several risks that should be factored into strategy and underwriting.
One risk is the recent contraction in employment. The twelve month decline of 1.0 percent in total nonfarm employment as of June 2026, combined with declines in sectors such as manufacturing, professional and business services, and information, suggests that parts of Virginia's economy are adjusting to changes in federal spending, technology, and global demand. If these trends continue, they could dampen office demand and slow household formation in certain submarkets.
A second risk is affordability pressure. With a statewide median sale price notably above the national median and double digit annual price increases in certain submarkets, some households may be priced out of ownership or forced into longer commutes. This can create political and community pressure for regulatory measures affecting development, zoning, and tenant protections, even though no statewide rent control regime is in place today.
Third, climate and physical risks, particularly coastal and riverine flooding and storm impacts, can damage properties, disrupt operations, and increase insurance and capital expenditure requirements. Properties in high risk zones may face rising insurance premiums, stricter lending criteria, or constraints on future development.
Fourth, data constraints in this environment mean that key metrics such as statewide population, median income, median rent, and vacancy rates are not observable from public sources. While these gaps do not change underlying fundamentals, they require investors to supplement this high level review with granular data and local expertise.
Finally, the broader capital markets environment of higher interest rates and tighter underwriting raises the cost of leverage and may compress return expectations for highly levered strategies. Value creation may need to rely more on operating improvements and less on multiple expansion.
Section 19Investor Implications
For accredited investors, Virginia offers a combination of scale, economic diversity, and structural demand drivers that can play a role in a diversified real estate portfolio. The state's high median home prices and persistent buyer competition may support multifamily and single family rental strategies, particularly in job rich and supply constrained submarkets. Industrial and logistics assets tied to the Port of Virginia and regional distribution corridors offer another avenue to consider for income and growth, provided tenant credit and lease structures are sound.
At the same time, the recent softening in employment and the absence of statewide numeric data on rents, vacancy, and income argue for a cautious and data intensive approach. Investors should prioritize markets and assets where tenant demand is durable, such as properties near major employment centers, transportation infrastructure, and educational and health care institutions. Conservative leverage, attention to insurance and climate risks, and a focus on operational excellence will be important.
Relative to higher growth Sun Belt markets, Virginia may offer somewhat slower top line growth but also potentially lower volatility and deep institutional participation in core submarkets. Positioning Virginia allocations as part of a barbell strategy, balancing growth oriented and stability oriented markets, may make sense for some portfolios. These are general observations, not recommendations, and outcomes are not assured.
Section 20Conclusion
Virginia's statewide real estate and multifamily market reflects the strengths and complexities of a large, economically diverse state at an inflection point. Labor market data show low unemployment but modest declines in total nonfarm employment, with professional and business services, manufacturing, and several service sectors contracting over the past year while education and health services and government remain relatively stable. Housing data from Redfin indicate that Virginia's median home price of 453,389 dollars and substantial share of homes selling above list price place it among higher cost and more competitive states, even as inventory begins to rise.
Data limitations in this environment preclude reporting key statewide metrics such as population, median income, rents, and vacancy rates, and proprietary datasets for commercial real estate performance are not accessible. The analysis therefore rests on Bureau of Labor Statistics labor figures, Redfin statewide housing metrics, regional population context from the Census state estimates file, and qualitative information about taxation, insurance regulation, infrastructure, and climate risk from Virginia and federal agencies.
For investors, Virginia presents areas of potential interest in multifamily, single family rentals, industrial and logistics, and select office and retail assets, particularly in and around major metros and corridors. Evaluating those areas requires disciplined underwriting, attention to submarket specifics, and careful management of regulatory, climate, and capital markets risks. This review provides a structured, data anchored foundation for that work, but it should be complemented by property level analysis and professional advice before any investment decisions are made.
Sources
- United States Bureau of Labor Statistics, Virginia Economy at a Glance, seasonally adjusted labor force and sector employment for January through June 2026, extracted August 7, 2026., https://www.bls.gov/eag/eag.va.htm
- United States Bureau of Labor Statistics, Current Employment Statistics, State and Area., https://www.bls.gov/sae
- United States Census Bureau, State Population Totals and Components of Change 2020 to 2025, NST EST2025 ALLDATA file, South Atlantic division row used, Virginia state row not visible in the truncated extract., https://www2.census.gov/programs-surveys/popest/datasets/2020-2025/state/totals/NST-EST2025-ALLDATA.csv
- United States Census Bureau, QuickFacts Virginia, access attempted and blocked by a Cloudflare security page., https://www.census.gov/quickfacts/fact/table/VA
- Redfin, Virginia Housing Market, House Prices and Trends, May 2026 metrics., https://www.redfin.com/state/Virginia/housing-market
- Redfin, United States Housing Market and Prices, May 2026 metrics., https://www.redfin.com/us-housing-market
- Virginia Housing, home page and news on mixed use affordable housing developments., https://www.virginiahousing.com
- Virginia Department of Taxation, home page with 2026 legislative and sales tax holiday updates., https://www.tax.virginia.gov
- Virginia State Corporation Commission, insurance section, access attempted with repeated redirects and no content extracted., https://scc.virginia.gov/pages/Insurance
- United States Department of Housing and Urban Development, Fair Market Rents documentation system interface., https://www.huduser.gov/portal/datasets/fmr/fmrs/FY2024_code/select_Geography.odn
- Federal Emergency Management Agency, Flood Maps., https://www.fema.gov/flood-maps
- National Centers for Environmental Information, home page., https://www.ncei.noaa.gov