In brief · summary: Washington
Washington State Real Estate Market Review
Section 01Executive Summary
Washington is a large, diverse coastal state whose real estate markets are anchored by the Seattle metropolitan area and complemented by secondary metros and smaller communities east of the Cascades. Public data accessible in this environment show that the statewide labor market in early 2026 is relatively tight, with unemployment around five percent and total nonfarm employment broadly flat year over year. Sector detail from the United States Bureau of Labor Statistics indicates that information, professional and business services, and education and health services remain large and generally stable employers, while construction and manufacturing have seen small employment declines or only modest gains over the past year. These figures frame a state economy that has cooled from the rapid expansion of prior years but remains fundamentally employed and diversified.
At the metropolitan level, the Seattle Bellevue Kent area carries an outsize share of Washington's jobs. BLS data for June 2026 show roughly 1.49 million total nonfarm jobs in this metro, with unemployment just under five percent and year over year job growth close to zero. Sector level data underscore the importance of construction, manufacturing, trade and transportation, information, and professional services to regional employment. Consumer price index readings for the Seattle Tacoma Bellevue area show annual inflation rates between about four and five percent in early 2026, which supports nominal rent and income growth but also raises cost pressures for households and operating expenses for property owners.
On the housing side, technical constraints in this environment prevent extraction of current state specific home price and inventory metrics for Washington from Redfin or other open providers, and access to Zillow is blocked. As a result, this review cannot state a statewide median sale price or number of homes for sale. Instead, it uses national Redfin housing data as context. In May 2026, Redfin reports that the median sale price across all home types in the United States was 398,771 dollars, up 2.0 percent compared with May 2025, with 1,483,839 homes for sale nationally and 24.9 percent of homes selling above list price. These national figures, combined with Washington's labor market, suggest that Washington likely remains a relatively expensive and competitive state in which incomes tied to technology, aerospace, and services continue to support housing demand, even as interest rates and affordability concerns temper activity.
Major structural constraints affect the depth of quantitative analysis. The United States Census Bureau QuickFacts page for Washington is blocked by Cloudflare in this environment, and the Census state population estimates file for 2020 through 2025 is truncated so that the Washington state row is not visible. As a result, this review cannot state Washington's current population, its annual population growth rate, or its median household income. HUD's Fair Market Rent interface does not expose numeric rents in the accessible text, and there is no public series here for Washington specific vacancy rates or capitalization rates. Throughout this review, when statewide or metro figures cannot be obtained from public sources, the gap is noted explicitly rather than filled with estimates.
For accredited investors, the implication is that Washington offers exposure to a mature, high income coastal economy with deep employment bases in information technology, aerospace, logistics, and health care, but the current data constraints require heavier reliance on labor statistics, national housing benchmarks, and qualitative assessment of markets such as Seattle, Tacoma, and Spokane. The opportunities center on demand for well located multifamily, single family rental, and industrial assets supported by strong job corridors, while the risks include affordability pressures, regulatory complexity in some jurisdictions, climate and seismic exposures, and a capital markets environment that remains demanding.
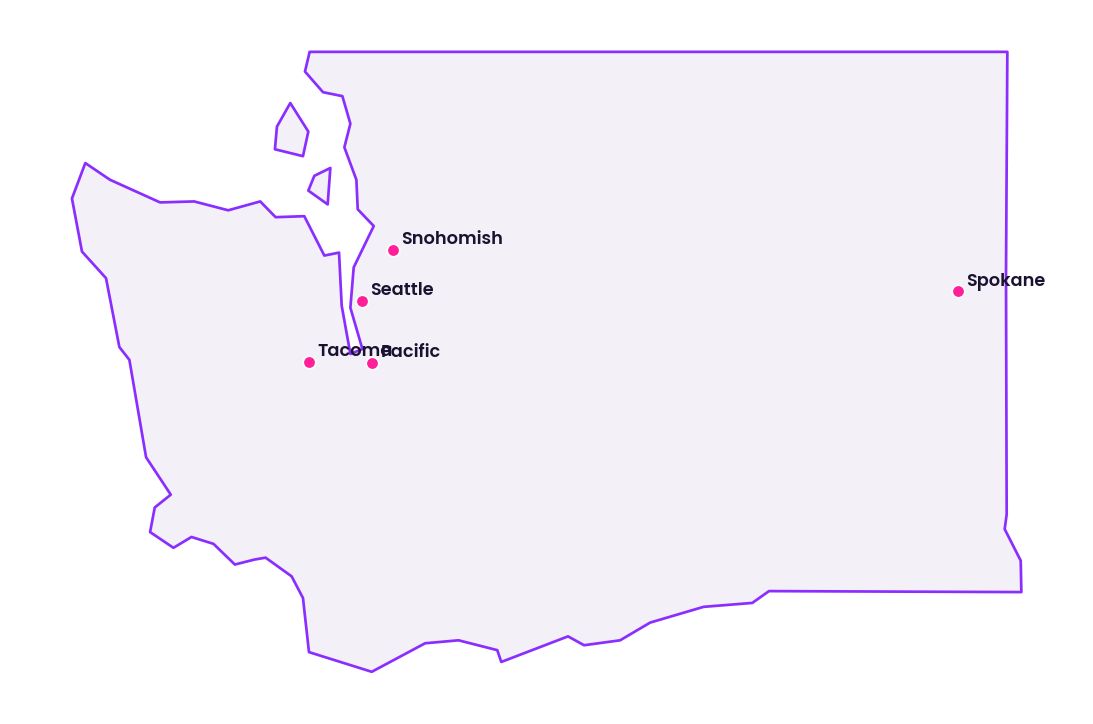
Section 02Population and Migration
Population size and growth are fundamental drivers of housing demand, but in this environment they are also some of the hardest metrics to quantify accurately for Washington. Access to the Census Bureau QuickFacts profile for Washington is blocked by a Cloudflare security page, which means this review cannot draw on the usual state level statistics such as population, age distribution, or household counts for recent years. The Census state population estimates file for 2020 through 2025 is accessible in part, but the text extract is truncated and does not display the Washington state row, even though it does list national and some regional totals. Because the Washington row is not visible and this review does not estimate or infer figures, this analysis does not state Washington's population numerically, and no official public numeric figure for the state population is available on this point in this environment.
The Census file does, however, provide useful national context. It reports that the United States population was estimated at 341,784,857 people as of July 1, 2025. Between 2024 and 2025, the national population increased by 1,781,060 people. Over that period, births totaled 3,620,461 and deaths totaled 3,101,603, resulting in a positive natural change of 518,858 people. Net international migration added 1,262,202 people. Because movement between states nets to zero at the national level, the natural increase of 518,858 people and net international migration of 1,262,202 people together account for the full national gain of 1,781,060 people. These national figures show that population growth in the country as a whole is driven by both natural increase and, to an even greater degree, international migration.
Redfin's national migration summary adds another layer. It notes that nationwide, 19 percent of homebuyers using its platform searched to move to a different metropolitan area between January and March 2026, highlighting the continued importance of cross metro migration in housing dynamics. The most common destination and origin states in that summary are concentrated in the Sun Belt and coastal markets, and Washington is not singled out among the top states for inflows or outflows in the accessible extract, which suggests that its migration flows are meaningful but not at the extremes of recent national patterns.
For Washington specifically, a long term narrative of net in migration, especially into the Puget Sound region, has underpinned strong housing demand and price growth over the past decade. In the absence of current official census figures in this environment, that history still informs investor expectations, but it must now be paired with local evidence from building permits, school enrollments, and traffic patterns when underwriting specific markets. The key conclusion is that while Washington likely continues to attract residents to its job centers and lifestyle amenities, this review cannot quantify that growth and therefore cannot tie specific population or migration rates to particular metros or counties.
Section 03Jobs and Economic Anchors
The most robust quantitative insight into Washington's current economic conditions comes from the Bureau of Labor Statistics Washington Economy at a Glance table. These data, which are seasonally adjusted and presented in thousands of persons or jobs, show a statewide labor market that is fully employed by historical standards but no longer expanding rapidly.
The table below summarizes core statewide labor indicators for the first half of 2026.
| Month 2026 | Civilian labor force, thousands | Employment, thousands | Unemployment rate, percent | Total nonfarm employment, thousands | Twelve month change in total nonfarm employment, percent |
|---|---|---|---|---|---|
| January | 4,065.1 | 3,860.7 | 5.0% | 3,639.3 | 0.1% |
| February | 4,066.4 | 3,858.3 | 5.1% | 3,637.2 | 0.2% |
| March | 4,064.4 | 3,855.4 | 5.1% | 3,639.1 | 0.3% |
| April | 4,062.7 | 3,850.4 | 5.2% | 3,639.4 | 0.0% |
| May | 4,065.8 | 3,853.5 | 5.2% | 3,645.0 | 0.0% |
| June (preliminary) | 4,059.3 | 3,849.6 | 5.2% | 3,642.9 | 0.0% |
These data indicate that Washington's unemployment rate has hovered around five to 5.2 percent through the first half of 2026, with little net change in total nonfarm employment on a year over year basis by June. The labor force has remained close to 4.06 million people, and the absolute number of unemployed persons has varied between roughly 204 and 212 thousand. For investors, this translates into a job market that is not in recession but is clearly past the period of rapid post pandemic expansion.
Sector detail provides a clearer view of the state's economic anchors. The table below shows Washington employment by sector in thousands of jobs for January and June 2026, alongside the twelve month percentage change through June, drawn from United States Bureau of Labor Statistics data.
| Sector | January 2026 (thousands) | June 2026 (thousands) | Twelve month change (percent) |
|---|---|---|---|
| Construction | 218.2 | 216.8 | -1.0% |
| Manufacturing | 271.0 | 274.0 | +1.1% |
| Trade, transportation, and utilities | 625.8 | 622.2 | -0.1% |
| Information | 164.8 | 165.3 | +1.1% |
| Professional and business services | 541.4 | 544.4 | +0.4% |
| Education and health services | Not reported | 569.5 | +0.7% |
| Leisure and hospitality | 343.4 | 350.2 | +1.3% |
| Government | Not reported | 611.9 | -1.2% |
In short, construction, trade and transportation, and government contracted modestly over the year, while manufacturing, information, education and health, and leisure and hospitality posted small gains. Professional and business services continued to grow, but at a slower pace. January employment for education and health services and for government was not separately reported in the accessible source, so those cells are left as not reported rather than estimated.
At the metropolitan scale, the Seattle Bellevue Kent Economy at a Glance table shows that this region alone accounted for about 1,491.8 thousand total nonfarm jobs in June 2026, up from 1,459.0 thousand in January. The metro unemployment rate declined from 5.7 percent in January 2026 to 4.7 percent in May, before ticking back up to 4.9 percent in June. Sector employment patterns in Seattle mirror the statewide trends but with higher concentrations in information and professional services. For example, construction employment in the metro was 67.4 thousand jobs in January and 70.8 thousand in June, still down modestly year over year, while manufacturing hovered around 92 to 93 thousand jobs with year over year growth just above one percent by June. Information employment in Seattle was 127.0 thousand jobs in June 2026, with essentially flat twelve month growth, and professional and business services reached 310.2 thousand jobs, with year over year growth of about 0.6 percent.
Non quantitative but well established anchors round out this picture. Washington's economy is home to globally significant employers in software, cloud computing, e commerce, aerospace, and advanced manufacturing. Large companies headquartered or deeply embedded in the state include Microsoft, Amazon, and Boeing, along with a broad ecosystem of technology startups, life sciences firms, logistics providers, and professional services companies. These employers are concentrated in the Seattle metropolitan area but support demand for housing, industrial, and office space across the Puget Sound and beyond.
For real estate investors, the BLS data and the known corporate footprint together indicate that Washington's employment base is large, diversified, and still growing modestly in aggregate, but that cyclical slowing is evident in construction and some white collar service sectors. This context supports a focus on assets linked to durable demand drivers, such as logistics tied to trade and transportation and housing near stable employment nodes, while underlining the need to underwrite office and construction exposed segments with caution.
Section 04Income
Household and personal income levels are crucial to understanding rent and price support, yet the key public data sources for Washington income are not accessible in a way that yields current numbers in this environment. As noted earlier, the Census QuickFacts profile for Washington is blocked, and American Community Survey tables that usually provide median household income, per capita income, and income distribution by state are not visible in the accessible extracts.
The Bureau of Economic Analysis publishes state personal income and earnings figures, but the BEA interactive tools for these series do not appear in the text extracts available here in a form that exposes specific numeric values for Washington in 2024 or 2025. Without those values, this review cannot state median household income, per capita income, or personal income per capita for Washington, and no official public numeric figure is available on those points in this environment.
Qualitatively, Washington's income profile is shaped by high wage employment in technology, aerospace, and professional services in the Puget Sound corridor, contrasted with lower incomes in many rural and small metro areas. The large employment bases in information and professional and business services in the BLS data suggest that average wages in these regions are above national averages, while construction, manufacturing, and trade jobs provide middle income employment across the state. For investors, the absence of current numeric income figures means that assessments of affordability, rent to income ratios, and purchasing power must rely on property level leasing data, local wage information from major employers, and management reports rather than statewide medians.
Section 05Housing and Multifamily
Multifamily housing in Washington is shaped by strong demand in coastal and metro areas, substantial new construction in prior years, and more recent adjustments due to higher interest rates and changing migration patterns. However, in this environment there is no accessible statewide public dataset that provides current numeric values for Washington's median apartment rents, unit counts, or absorption. Proprietary multifamily datasets from private providers are not open, and HUD's Fair Market Rent interface does not reveal dollar rents in the text extract.
As a result, this review relies on national housing metrics for context and labor market data for demand drivers. Redfin's United States housing market overview for May 2026 reports that the national median sale price across all home types was 398,771 dollars, an increase of 2.0 percent compared with May 2025. There were 1,483,839 homes for sale across the country, up 0.7 percent year over year, and 24.9 percent of homes sold above list price, a share that declined by 0.083 percentage points compared with a year earlier. These metrics indicate that the national housing market remains tight but is moving away from the extreme conditions of the early 2020s, with price growth moderating and inventory slowly expanding.
By comparison, Washington's known history as a relatively high cost coastal state with supply constraints in key metros suggests that its multifamily markets are likely tighter than the national average in core cities such as Seattle and Bellevue, with more moderate conditions in secondary metros and rural areas. The BLS data showing stable employment in information and professional services and continued growth in leisure and hospitality support ongoing demand for rental housing, especially in walkable, amenity rich neighborhoods near job centers and transit. However, without current numeric rent or vacancy series, this review cannot quantify rent levels, rent growth, or absorption for Washington.
Investors looking at Washington multifamily assets therefore need to rely on a combination of property level operating statements, management company benchmarks, and proprietary third party data. The public information available here does confirm that the underlying economy remains employed and that national housing markets are still characterized by constrained supply and positive price growth, which supports the case for long term demand in Washington's better located multifamily properties.
Section 06Rents
Current, statewide numeric data on Washington rents are not accessible in this environment. HUD's Fair Market Rent documentation system for fiscal year 2024 is available only through an interactive geography selector, and the accessible text does not include any dollar rent amounts for Washington counties or metropolitan areas. American Community Survey tables that would typically report median gross rent, rent burden, and the share of households spending different fractions of income on rent are not visible in a usable way for Washington, and open access rent series from private providers are either not available at the state level or are behind technical barriers.
Because of these limitations, this review cannot state median monthly rent for apartments in Washington, cannot provide rent levels by unit size in key metros, and cannot quantify statewide rent growth rates or rent to income ratios, and no official public numeric figure is available on those points in this environment. Instead, it can only describe qualitative patterns. In the Puget Sound region and other high demand areas, rents have historically been elevated relative to national averages due to high incomes in information and professional services, geographic constraints on supply, and strong amenity value. In smaller metros and rural areas, rents are lower but still influenced by local wage levels and housing stock conditions.
For investors, this means rent assumptions in Washington must be grounded in the specific rent rolls and lease histories of target properties, cross checked against local broker surveys and management reports. Public data can still provide context on inflation, as consumer price indices for Seattle Tacoma Bellevue show twelve month increases in the price level between roughly 3.9 and 4.9 percent in early 2026, which constrains tenant budgets and raises operating costs. However, without explicit rent series, investors should use conservative rent growth projections and scenario testing to assess downside risk.
Section 07Vacancy
Vacancy rates in multifamily, single family rental, office, industrial, and retail properties are central to underwriting risk, yet this environment does not expose current Washington specific vacancy statistics. The Census Housing Vacancy Survey provides national vacancy data, but its state level detail is not visible in the accessible extracts. American Community Survey housing tables that normally report rental and homeowner vacancy rates by state are likewise not usable here. Commercial vacancy series maintained by brokerage houses and private data providers are not open.
Accordingly, this review cannot state Washington's overall rental vacancy rate, cannot provide vacancy rates for specific Washington metros, and cannot quantify office, industrial, or retail vacancy by market or submarket, and no official public numeric figure is available on those points in this environment. It also cannot present time series of vacancy over the past several years for any Washington asset class.
Qualitatively, prior cycles and observed leasing conditions suggest that vacancy in core urban submarkets such as downtown Seattle office has risen compared with pre pandemic levels, while industrial vacancy in well located logistics corridors has remained tighter due to ongoing demand for warehouse and distribution space. Multifamily vacancy has likely increased from the extreme lows of the pandemic era as new supply has delivered and migration patterns have normalized, but remains within a range that supports rent growth in strong locations. Because these assessments cannot be tied to public numeric series in this environment, they should be treated as high level context rather than precise measures.
For accredited investors, the lack of public vacancy data reinforces the need for granular property level and submarket level due diligence. Current occupancy, lease up pace, renewal rates, and concessions provide the most reliable insight into vacancy related risk for a given asset, and these metrics should drive underwriting rather than any assumed statewide vacancy benchmarks.
Section 08Supply Pipeline
The supply pipeline for residential and commercial properties in Washington consists of new construction, redevelopment, and adaptive reuse projects, all of which are influenced by construction employment, permitting activity, and capital availability. Public permitting data from state and local government and detailed construction starts and completions series from Census and private providers would typically quantify this pipeline, but in this environment those datasets are not accessible in a form that yields Washington specific counts of housing units or square footage.
An informative proxy is construction employment. BLS data show that statewide construction employment in Washington was 218.2 thousand jobs in January 2026, declined slightly to 217.6 thousand in April, and stood at 216.8 thousand in June 2026. The twelve month percentage change in construction employment was negative 0.9 percent in January, improved somewhat to negative 0.3 percent in February, and then moved between negative 0.4 and negative 1.3 percent through June, ending at negative one percent. These figures suggest that construction activity is off its recent peak, likely due to higher borrowing costs, softening in some segments, and project delays or cancellations where feasibility has been challenged.
In the Seattle Bellevue Kent area, BLS metro level data show a similar pattern. Construction employment there was 67.4 thousand jobs in January 2026 and increased to 70.8 thousand in June, but the twelve month percentage change remained negative through May and was still about negative 0.8 percent in June. This indicates that while the headcount has risen since the start of the year, it remains below levels from a year earlier.
Washington's Department of Commerce notes that it manages a budget of 7.9 billion dollars and focuses heavily on housing, energy, local government support, and community development. This confirms that substantial state funding is available for housing and infrastructure projects, including affordable housing production and preservation. The Washington State Housing Finance Commission highlights initiatives such as the Washington Family Housing Fund and programs for developers of housing for seniors and for manufactured home community ownership. These programs reflect policy attention to housing supply and affordability even as private market construction moderates.
For investors, the key takeaway is that new supply is still coming to market in Washington but at a slower pace than during the low interest rate era. In high demand submarkets, this may mitigate the risk of overbuilding and support rent levels in existing assets. In submarkets with large deliveries or weaker demand, elevated vacancy and slower lease up remain concerns. Because no public numeric pipeline data are available here, investors should rely on local permit records, planning documents, and brokerage construction trackers for asset specific decisions.
Section 09Single Family Homes
Single family homes, including both owner occupied and single family rental properties, are a major component of Washington's real estate landscape. In many regions, they are the primary form of housing and a key vehicle for household wealth and investment returns. Unfortunately, in this environment there is no accessible statewide public dataset that provides current figures for Washington's median sale price for single family homes, the number of single family listings, months of supply, or state specific measures of buyer or seller market conditions.
Attempts to retrieve Washington housing metrics from Redfin's state housing market page did not yield any readable content, even though the same method successfully retrieved national data. Access to Zillow's state level home value pages is blocked by an access denied response. As a result, this review cannot state Washington's median single family sale price, its year over year price change, or its single family inventory, and no official public numeric figure is available on those points in this environment.
National data provide some orientation. Redfin reports that across the United States the median sale price for all home types was 398,771 dollars in May 2026, up 2.0 percent from a year earlier. The number of homes for sale was 1,483,839, up 0.7 percent year over year, and 24.9 percent of homes sold above list price. These metrics suggest that nationally the market is still modestly tilted toward sellers, with prices rising and a nontrivial share of homes attracting multiple offers, but with more inventory available than in the tightest years of the last cycle.
Washington's position as a higher cost coastal state with significant concentrations of high income jobs implies that its single family markets in core metros such as Seattle, Bellevue, and parts of King, Snohomish, and Pierce counties likely have median prices above the national figure, while more rural counties and smaller metros provide more affordable entry points. For investors pursuing single family rental strategies, the combination of high home prices in core metros and more moderate prices in secondary markets suggests a spectrum of potential yield profiles. However, without current public price and inventory data, decisions about yields, appreciation, and rent to price ratios must be grounded in local broker opinions, comparable sales, and multiple listing service level data rather than state aggregates, and no particular outcome is assured.
Section 10Commercial Real Estate and Retail Centers
Commercial real estate in Washington spans office towers in downtown Seattle and Bellevue, industrial and logistics facilities along ports and highways, and a range of retail properties from regional malls to grocery anchored neighborhood centers. Yet in this environment there is no open dataset that provides current Washington specific numeric values for commercial vacancy, asking rents, or capitalization rates by property type. Many such series are maintained by national brokerage firms and are proprietary.
Still, sector level employment and known structural trends provide a useful framework. Statewide BLS data show that trade, transportation, and utilities employed 622.2 thousand people in June 2026, with only a slight decline over the past year. This sector underpins demand for warehouses, logistics facilities, and distribution centers, particularly in port oriented and highway adjacent locations in the Puget Sound region and along the Columbia River corridor. The modest year over year change indicates that industrial and logistics demand remains intact even as macroeconomic growth slows.
Information and professional and business services, which together account for more than 700 thousand jobs statewide, are core users of office space, especially in urban and suburban office clusters. The employment data show very small year over year growth rates in these sectors by mid 2026, reflecting a moderation in hiring that aligns with high profile announcements of slower headcount growth or restructuring among major technology firms. This environment has contributed to higher office vacancy in many markets, particularly in older or less centrally located buildings, and has strengthened tenant leverage in lease negotiations. Without numeric vacancy or rent series, this review cannot quantify those effects, but the directional risk for office assets is clear.
Leisure and hospitality employment, at about 350.2 thousand jobs in June 2026 with year over year growth of 1.3 percent, supports demand for restaurant and entertainment oriented retail space. Retail more broadly is in transition due to ongoing growth in e commerce and changing consumer spending patterns. Grocery anchored centers, neighborhood shopping centers with essential services, and well located urban retail with strong foot traffic are generally better positioned, while older malls and commodity strip centers face greater pressure.
Because numeric vacancy, rent, and cap rate data are not available here, investors must evaluate commercial assets in Washington primarily through tenant rosters, lease terms, property condition, and competitive positioning. In office, focus on well located, high quality buildings with strong tenants and realistic leasing assumptions. In industrial, prioritize assets near ports, intermodal facilities, and major highways. In retail, emphasize centers with durable demand drivers such as grocery anchors, pharmacies, and essential services.
Section 11Transactions and Capital Markets
Transaction volume, pricing, and capitalization rates are core inputs to any investment thesis, but they are also areas where public data are limited in this environment. There is no open statewide series from a public agency that reports Washington's commercial real estate transaction volume or average cap rates by asset class, and major transaction databases are proprietary.
From a capital markets standpoint, interest rates remain higher than in the period before 2022, which raises debt service costs for all property types. Lenders have generally responded by tightening underwriting standards, lowering permissible leverage, and focusing on strong sponsors and stabilized assets. These broader conditions affect Washington similarly to other states, with particular scrutiny applied to office and certain retail segments.
The absence of numeric transaction data here means that this review cannot quantify changes in transaction volume or cap rates for Washington over the past year, and no official public numeric figure is available on those points in this environment. However, anecdotal evidence and national patterns suggest that transaction activity has slowed and that pricing has adjusted downward in sectors with higher perceived risk, while more resilient sectors such as industrial and well located multifamily have seen smaller valuation shifts. For accredited investors, the key implications are that equity checks may need to be larger, return expectations should account for higher financing costs, and exit cap rate assumptions should reflect potentially wider spreads, especially for riskier asset classes.
Section 12Taxes
State and local taxes influence both operating costs and after tax returns. The Washington Department of Revenue describes a tax system that includes retail sales and use taxes, business and occupation taxes, property taxes, and other levies. The department provides information on sales and use tax rates, tax incentives, business and occupation tax, retail sales tax, use tax, property tax, and other taxes, along with guidance on filing, refunds, and education. This confirms that property taxes are an established part of Washington's revenue system and that businesses face multiple tax categories.
In this environment, however, there is no accessible numeric series that provides the effective property tax rate for Washington as a whole or for its counties, nor is there a public dataset visible here that quantifies average tax burdens on residential or commercial parcels across the state, so no official public numeric figure is available on those points in this environment. The absence of accessible data also extends to detailed breakdowns of state and local property tax rates, assessment ratios, or statutory caps.
Qualitatively, Washington is known for relying more heavily on sales and property based taxes than on broad based personal income taxes, which shapes the way tax burden is distributed across households and businesses. For real estate investors, this means that thorough due diligence on property specific assessments, levy rates within taxing districts, and any applicable exemptions or incentives is essential. The Department of Revenue provides forms, publications, and industry guides that can support those efforts, but the current technical constraints mean this review cannot quote specific tax rates.
Section 13Insurance
Insurance costs and coverage terms directly affect net operating income and lender requirements. The Washington Office of the Insurance Commissioner serves as the state regulator overseeing insurers and consumer protection. The office reports that its consumer protection advocates recovered 30.8 million dollars from insurers for consumers as of July 31, 2026, a figure that underscores active oversight and enforcement. The commissioner's office also highlights community outreach initiatives related to fraud prevention and wildfire mitigation, demonstrating a focus on both financial and physical risk.
There is no publicly accessible statewide dataset in this environment that provides average property insurance premiums for Washington by region or property type, nor are there quantified loss ratios or claim frequencies for real estate exposures, and no official public numeric figure is available on those points in this environment. Insurance market conditions in Washington are affected by regional hazards such as earthquakes, wildfires, flooding, and windstorms, as well as by national reinsurance costs and capital availability.
For investors, this means that insurance must be evaluated at the asset level through broker quotes and carrier underwriting feedback. Properties in higher risk areas, such as those in wildfire prone zones or in low lying coastal or riverfront locations, may face higher premiums, tighter terms, or deductibles that materially affect cash flow. The presence of an engaged state insurance regulator can help ensure fair practices and consumer recourse, but it does not eliminate risk from rising premiums in hazard exposed areas.
Section 14Landlord Tenant and Regulatory Environment
Landlord tenant law in Washington is governed primarily by state statutes, with some local jurisdictions, particularly in the Puget Sound region, adopting additional regulations related to rent increases, tenant protections, and eviction procedures. In this environment, there is no statewide numeric dataset that quantifies the number of rental units subject to local ordinances, the average eviction timeline, or the distribution of lease types across the state.
Qualitatively, Washington has strengthened tenant protections in recent years, including requirements for notice prior to certain rent increases, limitations on some types of evictions, and procedural safeguards for tenants. Some cities, including Seattle, have adopted local ordinances related to move in fees, winter eviction protections, and rental housing registration. For investors, this creates a regulatory landscape that can vary materially by jurisdiction within the state.
Because this review cannot access a comprehensive summary of current statutes and ordinances in numeric or tabular form, it does not attempt to list specific regulatory thresholds or timelines. Instead, it emphasizes that accredited investors and sponsors considering residential investments in Washington should engage local counsel, review applicable state and municipal codes, and incorporate regulatory risk into their underwriting. In commercial segments, lease terms and enforcement also operate within this legal framework, though with generally more contractual freedom than in residential.
Section 15Infrastructure
Infrastructure investments in transportation, utilities, and community facilities support real estate performance across Washington. The Washington State Department of Commerce notes that it manages a budget of 7.9 billion dollars and administers programs in housing, energy, local government support, economic development, and community services. This indicates a significant state level commitment to funding and coordinating infrastructure and community projects that can affect both urban and rural markets.
Specific statewide datasets on miles of roadway improved, transit expansions, or capital projects by county are not visible in this environment, so no official public numeric figure is available on those points here. However, the Department of Commerce's emphasis on funding from the state's climate commitment mechanisms and other sources suggests that significant resources are being directed to projects that address both infrastructure needs and climate resilience. Such investments can include transit oriented development, energy efficiency upgrades, and public facility improvements.
For investors, infrastructure considerations in Washington include proximity to major highways and ports, access to transit in urban areas, and the quality and capacity of water, sewer, and energy networks. These factors can enhance the attractiveness and durability of assets, especially in markets where state and local governments are actively investing in upgrades. Because this review cannot quantify those investments by region, property level due diligence and engagement with local planning documents remain essential.
Section 16Climate and Physical Risks
Washington's geography exposes it to a range of climate and physical risks, including riverine and coastal flooding, wildfires, landslides, and earthquakes. FEMA's flood map guidance explains that floods can occur almost anywhere and that any area with at least a one percent annual chance of flooding is considered high risk. Such areas have at least a one in four chance of experiencing a flood during a thirty year mortgage period. While this review does not access parcel specific flood maps for Washington, the principle applies across the state, since properties in mapped high risk zones face higher flood risk and, typically, stricter insurance and financing conditions.
The National Centers for Environmental Information maintains one of the world's largest environmental data archives, covering oceanic, atmospheric, and geophysical records, and provides access to climate, coastal, oceanographic, and geophysical data. These records document changes in temperature, precipitation, storm patterns, and other climate factors that influence hazard profiles. For the Pacific Northwest, climate records show trends toward warmer temperatures, changing snowpack, and shifts in the timing and intensity of precipitation, which can affect both flood and wildfire risk, though this review does not quote specific numeric changes.
In practical terms, Western Washington faces notable risks from heavy rainfall, river flooding, and landslides, especially in steep terrain and areas with saturated soils. Coastal communities also face storm surge and long term sea level concerns. Eastern Washington, with its drier climate, has significant wildfire risk that can affect both urban interfaces and rural lands. Across the state, seismic risk from major faults represents a long horizon concern for structural resilience.
Investors should therefore assess each asset's location in relation to FEMA flood zones, wildfire hazard areas, and known fault lines, and should incorporate potential capital expenditures for seismic upgrades, drainage improvements, and defensible space into their plans. Lenders may impose their own requirements, including mandatory flood insurance for properties in high risk zones and scrutiny of structural designs in seismic areas.
Section 17Opportunities
Despite data limitations, several opportunity themes emerge for accredited investors considering Washington.
First, the state's employment base remains large and diversified, with about 3.64 million total nonfarm jobs and a labor force of roughly 4.06 million people in mid 2026. While year over year job growth has slowed to near zero, unemployment around five percent and stable employment in key sectors such as information, professional services, education, health care, and logistics indicate a fundamentally healthy demand backdrop. Multifamily and single family rental assets near these employment centers can benefit from steady tenant demand.
Second, the Seattle Bellevue Kent metro, with nearly 1.5 million nonfarm jobs and concentrations in high wage information and professional services, offers exposure to households with strong incomes and housing preferences that support both urban multifamily and suburban single family demand. Investors who can navigate local regulations and higher entry prices may find durable, income oriented opportunities in well located assets serving this population.
Third, Washington's role as a gateway for international trade and its significant logistics infrastructure create ongoing demand for industrial and warehouse properties. Stable employment in trade, transportation, and utilities supports the case for investments in distribution centers, last mile facilities, and light industrial parks near ports and highway interchanges.
Fourth, substantial state level funding administered by the Department of Commerce and programs from the Washington State Housing Finance Commission provide potential support for affordable and workforce housing projects. The Department of Commerce reports a budget of 7.9 billion dollars across housing, energy, local government, economic development, and community services, and the presence of dedicated programs, including initiatives like the Washington Family Housing Fund, indicates policy support for certain types of residential investments, particularly those that address affordability and sustainability.
Finally, national housing data showing continued price appreciation and moderate but positive inventory growth suggest that long term housing demand remains strong relative to supply. In a state with constrained buildable land in some metros and environmental and regulatory considerations that slow development, existing properties in desirable locations may maintain pricing power over time, though this is not assured.
Section 18Risks
The same factors that create opportunity in Washington also generate risk.
One key risk is that job growth has slowed significantly, with BLS data showing zero percent year over year growth in total nonfarm employment by June 2026. While employment remains high, a prolonged period of flat or negative growth would weaken demand for space in some segments, particularly office and discretionary retail. The modest declines in construction employment and the negative year over year growth in financial activities suggest that some cyclical sectors are already under pressure.
A second risk is regulatory complexity in housing, especially in larger municipalities. Enhanced tenant protections, local ordinances that affect rent increases and eviction procedures, and evolving building codes can increase compliance costs and constrain operating flexibility. Because the details vary by jurisdiction and this review cannot provide a quantitative summary, investors must assume that regulatory risk is a material factor, particularly in Seattle and neighboring cities.
Third, affordability pressures pose a risk to both households and investors. While this review cannot quantify Washington's income or rent levels, the combination of high national home prices, inflation in consumer prices in Seattle Tacoma Bellevue, and elevated financing costs suggests that many households face tight budgets. This can limit rent growth potential in some segments and increase delinquency risk, especially for lower income tenants.
Fourth, physical and climate risks are significant. Flooding, wildfires, landslides, and earthquakes can cause property damage, business interruption, and insurance challenges. As climate patterns evolve, areas previously perceived as lower risk may experience more frequent or severe events, with implications for insurability and long term resilience.
Finally, capital markets conditions remain a challenge. Higher interest rates, tighter lending standards, and uncertainty about future monetary policy can compress returns, make refinancing more difficult, and widen bid ask spreads in transaction markets. These issues are particularly acute for properties with near term loan maturities, significant capital expenditure needs, or exposure to weaker tenant bases.
Section 19Investor Implications
For accredited investors, Washington offers a combination of structural strengths and data driven challenges. The structural strengths include a large, diversified employment base anchored by globally significant firms in technology, aerospace, and logistics, strategic coastal and trade geography, and substantial state level investment in communities, housing, and climate related initiatives. These factors support long term demand for housing and space in key corridors.
The data challenges stem from limited access to current census, housing, rent, and vacancy series at the state and metro level in this environment. Investors cannot rely on easily referenced statewide medians for population, income, rent, or vacancy. Instead, they must lean heavily on BLS labor data, national housing context, and detailed property and submarket level information from local sources and proprietary datasets.
In practice, this means that Washington allocations should emphasize thorough due diligence, conservative assumptions, and a focus on assets where the linkage between employment drivers and space demand is clear. Multifamily and single family rental properties near stable job centers, industrial and logistics assets along established trade routes, and well located retail serving essential needs are all candidates for durable income. Office and discretionary retail assets require extra care, with attention to tenant quality, lease maturities, and alternative use potential.
Portfolio construction should treat Washington as a core plus or value add component within a broader national strategy, with positions sized to reflect both the strength of its economy and the volatility associated with regulatory and physical risks. Diversification across metros, property types, and business plans within the state can help manage idiosyncratic exposure.
Section 20Conclusion
Washington's real estate markets sit at the intersection of a mature, high wage coastal economy and a national housing environment that remains undersupplied relative to long term demand but is adjusting to higher interest rates and softer growth. Public labor data show a state with low unemployment, stable employment in key sectors, and a dominant metropolitan area in Seattle Bellevue Kent. National housing data point to continued price appreciation and constrained supply, while state and local programs emphasize housing affordability and community investment.
At the same time, the inability to access current census figures, state level housing metrics, and detailed rent and vacancy series in this environment limits the precision of quantitative analysis. This review has therefore focused on the strongest available public datasets and has avoided conjecture where numbers are missing. For accredited investors, the path forward involves leveraging this high level framework while supplementing it with local knowledge, proprietary data, and rigorous due diligence on specific assets and submarkets.
Washington remains a substantial but complex market. Its long term fundamentals are supported by diverse employment and strategic geography, yet success requires careful navigation of regulatory landscapes, climate risks, and capital markets constraints. This review is intended to provide an educational foundation for that work, not a substitute for transaction specific analysis or professional advice.
Sources
- United States Bureau of Labor Statistics, Washington Economy at a Glance, statewide labor force, unemployment, and sector nonfarm employment data, January through June 2026, seasonally adjusted, extracted August 7, 2026
- United States Bureau of Labor Statistics, Seattle Bellevue Kent, Washington, Economy at a Glance, metropolitan labor force, unemployment, nonfarm employment by sector, and Seattle Tacoma Bellevue consumer price index data, January through June 2026, not seasonally adjusted, extracted August 7, 2026
- United States Census Bureau, State Population Totals and Components of Change 2020 to 2025, NST EST2025 ALLDATA, national population, births, deaths, and migration components for 2025, Washington state row not visible in truncated extract
- Redfin, United States Housing Market and Prices, median sale price, homes for sale, and share of homes sold above list price, May 2026, nationwide, including national migration share of homebuyers searching to move to a different metro
- Redfin, Washington Housing Market, state page accessed, no readable content returned in this environment
- United States Department of Housing and Urban Development, Fair Market Rents, Fiscal Year 2024 documentation system, geography selection interface for states and counties, no numeric rents visible in extract
- Washington State Housing Finance Commission, home page describing mission, equity commitments, Washington Family Housing Fund announcement, resources for developers and investors, and information for bond investors
- Washington State Department of Commerce, home page describing mission, budget of 7.9 billion dollars, and focus areas in housing, energy, local government, economic development, and community services
- Washington Department of Revenue, home page outlining tax system including sales and use tax rates, business and occupation tax, retail sales tax, use tax, property tax, and other taxes, along with filing and education resources
- Washington Office of the Insurance Commissioner, home page noting that consumer protection advocates recovered 30.8 million dollars from insurers for consumers as of July 31, 2026, and describing community outreach initiatives including wildfire mitigation resources
- Federal Emergency Management Agency, Flood Maps, general description of flood risk categories, including definition of areas with at least a one percent annual chance of flooding and explanation that such areas have at least a one in four chance of flooding during a thirty year mortgage period
- National Centers for Environmental Information, home page describing environmental data archives and providing access to climate, coastal, oceanographic, and geophysical data