In brief · summary: West Virginia
West Virginia State Real Estate Market Review
Section 01Executive Summary
West Virginia is a small Appalachian state with an economy that is gradually diversifying beyond traditional energy and manufacturing into health care, education, and service industries. Public labor data from the United States Bureau of Labor Statistics show that the statewide unemployment rate was 4.2 percent in June 2026 on a seasonally adjusted basis, with a civilian labor force of 773.4 thousand people and 740.7 thousand employed. Total nonfarm employment stood at 719.2 thousand jobs in June 2026, only modestly above 716.9 thousand jobs in January, with a twelve month employment growth rate of 0.3 percent. These figures describe a labor market that is stable rather than high growth, with notable sector differences.
Sector employment data highlight the continued importance of energy, construction, manufacturing, and health services. In June 2026, mining and logging, which in West Virginia primarily reflects coal and natural gas related activity, provided 19.5 thousand jobs but was down 4.4 percent compared with a year earlier. Construction employment was 36.3 thousand jobs and had grown 3.7 percent year over year, while manufacturing accounted for 45.0 thousand jobs and was down 0.4 percent over the year. Education and health services were the largest private sector employer at 148.1 thousand jobs, up 2.3 percent year over year, and professional and business services provided 73.1 thousand jobs, up 1.1 percent. These patterns indicate that health care and services are offsetting softness in energy and heavy industry.
On the for sale housing side, Redfin's statewide West Virginia housing market summary reports that in May 2026 the median sale price across all home types in the state was 266,553 dollars, an increase of 4.5 percent compared with May 2025. There were 5,801 homes for sale in West Virginia in May 2026, up 1.6 percent year over year, and 21.2 percent of homes sold above list price, an increase of 3.7 percentage points compared with a year earlier. In national context, Redfin reports that the United States median sale price across all home types in May 2026 was 398,771 dollars, up 2.0 percent year over year, with 1,483,839 homes for sale nationally and 24.9 percent of homes selling above list price. These figures show that West Virginia's typical home price is well below the national median but that price growth has been somewhat faster than the national average over the past year, with a material share of properties selling above list.
There are also important data gaps. The Census Bureau QuickFacts profile for West Virginia is blocked in this environment by a Cloudflare security page, and the state population estimates file that is accessible is truncated before the West Virginia row. As a result, this review does not state the current official population of West Virginia, its median household income, or its detailed demographic composition. Standard public rent and vacancy series at the state level, including HUD Fair Market Rents and American Community Survey housing tables, are also not visible in a way that yields current numeric values. Proprietary sources that would normally be used for commercial vacancy, rent, and capitalization rate metrics are not available.
Within these constraints, this review relies on Bureau of Labor Statistics employment and unemployment data, Redfin statewide and national housing metrics, high level information from the West Virginia Housing Development Fund, and national hazard information from FEMA and NOAA. It focuses on what those sources reveal about the state's economic structure, housing market, and risk profile, and it is explicit wherever public data are missing.
Section 02Population and Migration
A clear understanding of population size and change is central to assessing real estate demand, but in this environment the main public tools for state level demographic data are constrained. The United States Census Bureau QuickFacts page for West Virginia returns a Cloudflare security message that blocks access to the underlying tables, so current population, age distribution, and median household income figures for the state cannot be retrieved from that source. The Census state population estimates file for 2020 through 2025 is accessible in comma separated form and shows detailed national and regional totals, but the extract is truncated before the West Virginia row appears, so the file does not provide a usable population number for the state itself, and no official public numeric population figure for West Virginia is available on this point in this environment.
The same Census state estimates file does, however, provide context at the national level. The table below summarizes the components of United States population change between 2024 and 2025, as reported in the United States row of that table.
| United States population, 2024 to 2025 | People |
|---|---|
| Population as of July 1, 2025 | 341,784,857 |
| Total population change | +1,781,060 |
| Births | 3,620,461 |
| Deaths | 3,101,603 |
| Natural increase | +518,858 |
| Net international migration | +1,262,202 |
Because movement between states nets to zero at the national level, the natural increase of 518,858 people and the net international migration of 1,262,202 people together account for the full national gain of 1,781,060 people. These figures confirm that, nationally, both natural increase and international migration are important drivers of population growth.
Redfin's national housing market summary provides additional insight into migration patterns that affect housing demand. Across the United States, Redfin reports that 19 percent of homebuyers using its platform searched to move to a different metropolitan area between January and March 2026. The top destination states for these prospective movers were Florida, Arizona, South Carolina, Tennessee, and Nevada, while the top origin states were California, New York, Illinois, Washington, and Massachusetts. The most searched destination metros were Orlando, Sarasota, Miami, Cape Coral, and Las Vegas, while the largest net outbound flows were from metros such as New York, Seattle, Los Angeles, San Francisco, and Washington, DC. Although this dataset does not quantify movements into or out of West Virginia specifically, it shows that interstate migration is a significant driver of housing demand in many regions.
For West Virginia, historical patterns suggest that the state has experienced modest net outmigration over long periods as residents move to larger metropolitan areas in neighboring states, while some retirees and remote workers have moved in seeking lower housing costs and access to outdoor amenities. However, because this review does not have access to current, state specific migration statistics or net migration totals from Census or other public sources, it cannot quantify those flows.
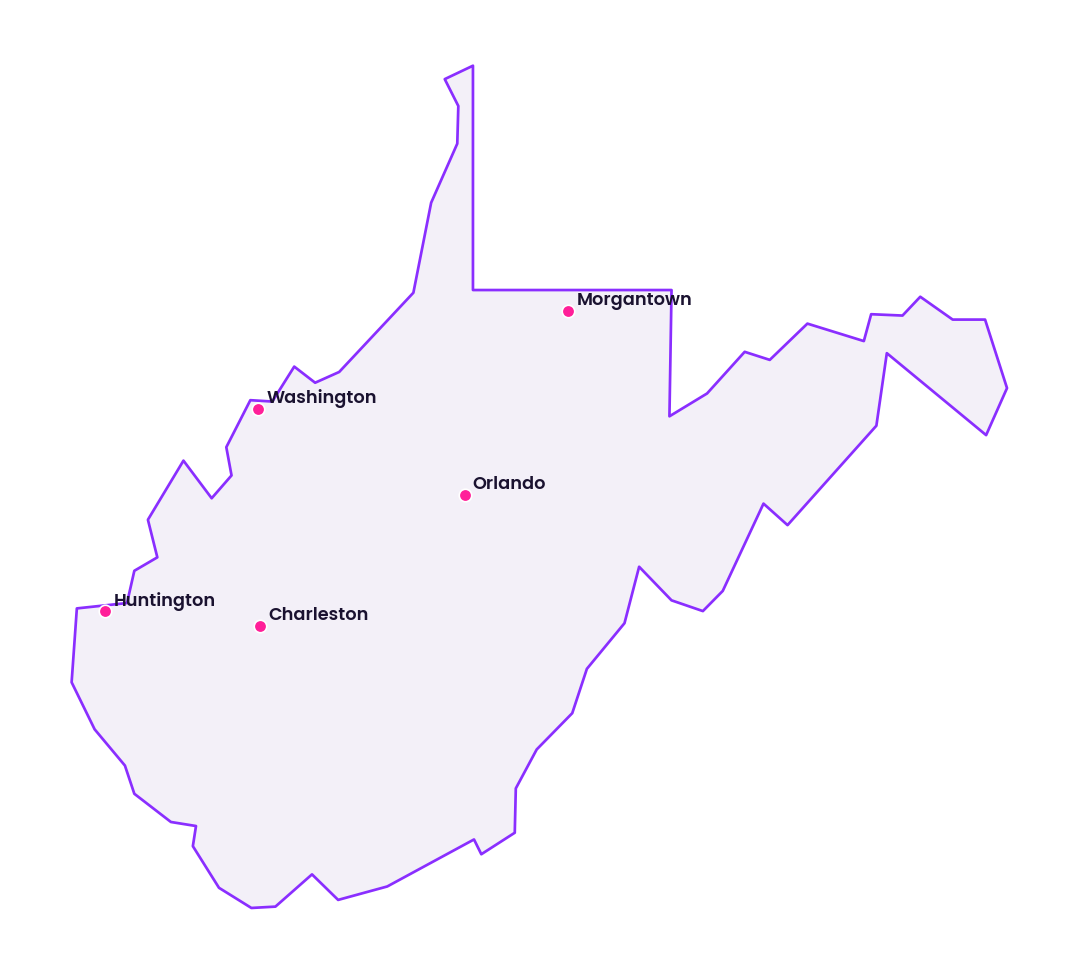
The implication for investors is that demographic analysis in West Virginia must rely more heavily on local sources such as school enrollment trends, utility connections, and permit activity, combined with on the ground knowledge of specific markets like Charleston, Huntington, Morgantown, and the Eastern Panhandle. The absence of a current, official population figure in this document does not mean that population is static, only that it cannot be measured precisely with the tools available here.
Section 03Jobs and Economic Anchors
The Bureau of Labor Statistics provides detailed, current employment and unemployment data for West Virginia that anchor any economic assessment. The statewide Economy at a Glance table, which is seasonally adjusted, shows that the civilian labor force in West Virginia was 782.6 thousand people in January 2026 and declined steadily to 773.4 thousand by June 2026. Over the same period, employment fell from 746.4 thousand to 740.7 thousand, while the number of unemployed persons declined from 36.3 thousand to 32.8 thousand. The statewide unemployment rate eased from 4.6 percent in January to 4.2 percent in June.
Total nonfarm employment in West Virginia was 716.9 thousand jobs in January 2026 and 719.2 thousand jobs in June 2026. Year over year, total nonfarm employment grew by 0.4 percent in January, contracted slightly by 0.4 percent in February and 0.3 percent in March, was flat in April, rose 1.2 percent in May, and settled at 0.3 percent growth in June. These modest figures indicate that, overall, West Virginia's labor market is stable but not rapidly expanding.
The table below summarizes the key statewide labor market indicators for the first half of 2026.
| Month 2026 | Civilian labor force, thousands | Employment, thousands | Unemployment rate, percent | Total nonfarm employment, thousands | Twelve month change in total nonfarm employment, percent |
|---|---|---|---|---|---|
| January | 782.6 | 746.4 | 4.6% | 716.9 | 0.4% |
| February | 782.1 | 745.5 | 4.7% | 715.4 | -0.4% |
| March | 779.2 | 744.0 | 4.5% | 716.3 | -0.3% |
| April | 777.0 | 742.5 | 4.4% | 717.5 | 0.0% |
| May | 775.1 | 741.7 | 4.3% | 728.3 | 1.2% |
| June (preliminary) | 773.4 | 740.7 | 4.2% | 719.2 | 0.3% |
Sector employment figures illustrate the composition of this job base. In June 2026, mining and logging employed 19.5 thousand people and had decreased 4.4 percent over the prior twelve months, reflecting the state's ongoing transition away from coal and traditional extraction industries. Construction provided 36.3 thousand jobs and was up 3.7 percent year over year, suggesting a modest expansion of building activity. Manufacturing accounted for 45.0 thousand jobs and was down 0.4 percent year over year, signaling relative stability with only a slight decline.
Trade, transportation, and utilities were responsible for 121.3 thousand jobs in June 2026, with employment down 0.2 percent compared with a year earlier. Information services had 7.5 thousand jobs and saw a 2.6 percent employment decline over the year, a small but notable contraction. Financial activities employed 25.9 thousand workers, up 0.4 percent year over year. Professional and business services provided 73.1 thousand jobs, with employment up 1.1 percent compared with June 2025. Education and health services were the largest private sector employer with 148.1 thousand jobs and recorded a 2.3 percent increase in employment over the year, underscoring the importance of health care and education as growth engines. Leisure and hospitality had 71.6 thousand jobs and experienced a small 0.3 percent decline over twelve months, while other services had 24.3 thousand jobs and grew 0.8 percent. Government employment stood at 146.6 thousand jobs in June 2026 and was down 1.4 percent compared with a year earlier.
Within the state, metropolitan areas exhibit distinct profiles. The Charleston metropolitan area, according to its own Economy at a Glance table, had a not seasonally adjusted labor force of 88.7 thousand people in June 2026, with 84.8 thousand employed and 3.9 thousand unemployed, for an unemployment rate of 4.4 percent. Total nonfarm employment in Charleston was 106.3 thousand jobs in June 2026, down 0.4 percent compared with a year earlier. Sector data for Charleston show that mining, logging, and construction provided 5.9 thousand jobs in June 2026 but had declined 4.8 percent over the year, manufacturing remained at 3.5 thousand jobs with a 2.8 percent decline, trade, transportation, and utilities had 16.2 thousand jobs with a 0.6 percent increase, and education and health services employed 24.9 thousand people with 1.6 percent growth over the year. Government in Charleston accounted for 23.5 thousand jobs and was down 0.8 percent year over year.
Taken together, these data portray West Virginia as a state where traditional resource extraction and manufacturing remain important but are no longer the principal sources of job growth. Instead, health care, education, and some professional services are adding jobs, while construction employment suggests a measured level of building activity. For real estate investors, this mix points toward stable but modest demand for space, with particular strength in markets and property types tied to health care, education, and logistics, and more caution warranted for assets heavily dependent on coal and legacy industrial uses.
Section 04Income
Income levels shape both housing affordability and the demand for commercial space. In this environment, however, current, official income statistics for West Virginia are not directly accessible from the usual public data sources. The Census Bureau QuickFacts page for West Virginia, which would normally provide median household income and per capita income figures, is blocked by a Cloudflare security page, preventing access to those tables. American Community Survey detailed income tables and Bureau of Economic Analysis per capita personal income tables for West Virginia are not visible in a format that exposes specific numeric values.
Because of these access constraints, this review does not state a current median household income for West Virginia, does not quantify per capita income, and does not report the share of households in specific income brackets, and no official public numeric income figure is available on those points in this environment. It also does not provide a formal comparison between median income in West Virginia and the national median, even though historically West Virginia has had lower average incomes than the United States as a whole.
For investors, the absence of current public income figures means that affordability analysis must rely on indirect evidence and local data. The relatively low statewide median sale price reported by Redfin, at 266,553 dollars in May 2026 compared with 398,771 dollars nationally, suggests that incomes in West Virginia support lower nominal housing prices than in higher income states. However, this inference should be tested using property level rent rolls, employer wage data where available, and local surveys of tenant incomes, rather than relying solely on statewide generalizations. Conservative assumptions about rent to income ratios and careful review of local economic conditions are prudent in underwriting.
Section 05Housing and Multifamily
West Virginia's housing market is characterized by relatively low prices in national context but meaningful competition in certain segments. According to Redfin's statewide housing market summary, home prices across all property types in West Virginia in May 2026 had a median sale value of 266,553 dollars. This represented a 4.5 percent increase in the median sale price compared with May 2025. Over the same period, the number of homes for sale in the state rose by 1.6 percent to 5,801, and 21.2 percent of homes sold above their list price, up 3.7 percentage points from a year earlier.
In comparison, Redfin reports that the national median sale price across all home types in May 2026 was 398,771 dollars, up 2.0 percent year over year, with 1,483,839 homes for sale across the United States, an increase of 0.7 percent. Nationally, 24.9 percent of homes sold above list price in May 2026, a slight decrease of 0.083 percentage points compared with the prior year.
The table below contrasts key price and competitiveness metrics for West Virginia and the United States in May 2026.
| Geography | Metric scope | Median sale price, all home types, dollars | Year over year change in median sale price, percent | Homes for sale, count | Year over year change in homes for sale, percent | Share of homes sold above list price, percent | Year over year change in share sold above list, percentage points |
|---|---|---|---|---|---|---|---|
| West Virginia | May 2026 | 266,553 | 4.5% | 5,801 | 1.6% | 21.2% | +3.7% |
| United States | May 2026 | 398,771 | 2.0% | 1,483,839 | 0.7% | 24.9% | -0.083% |
These figures highlight several important points. First, West Virginia's typical home price is significantly lower than the national median, which reflects both lower incomes and lower land and construction costs in many parts of the state. Second, price growth in West Virginia has recently been stronger than the national average, at 4.5 percent versus 2.0 percent, suggesting that demand has firmed relative to available supply. Third, while the share of homes selling above list price in West Virginia at 21.2 percent is slightly below the national figure of 24.9 percent, the increase over the prior year is notable, indicating that competitive bidding has intensified in some local markets.
For multifamily investors, these dynamics support a thesis that rental housing can serve households who are priced out of ownership even at these relatively modest price levels, particularly in submarkets where incomes are lower or savings for down payments are limited. The rise in for sale prices can push some demand into rental units, especially in growing corridors near universities, employment centers, and emerging lifestyle amenities.
Because public data in this environment do not provide statewide multifamily rent levels, vacancy rates, or new construction counts, investors must treat Redfin's for sale metrics as one of several indicators rather than a complete picture. Still, the combination of moderate price growth, increasing inventory, and a meaningful share of above list transactions suggests that West Virginia's for sale housing market is balanced to slightly tight, with pockets of stronger competition in and around larger employment centers like Charleston, Huntington, and Morgantown and in growing regions such as the Eastern Panhandle.
Section 06Rents
Current, public statewide rent statistics for West Virginia are not available in this environment in a form that yields reliable numeric values. HUD's fiscal year 2024 Fair Market Rent documentation tool presents an interface in which a user selects a state, then a county or metropolitan area, but the readable text contains only these selection prompts and does not display any dollar rent amounts for West Virginia or its metropolitan areas. American Community Survey tables that would normally provide median gross rent by state or by metropolitan area are not exposed in a usable text format here, and proprietary rent indices from private providers are not accessible.
Because of these limitations, this review does not quantify the median monthly rent for apartments in West Virginia, does not state rent levels by bedroom count, and does not provide a statewide rent growth rate, and no official public numeric rent figure is available on those points in this environment. It also does not present a formal rent to income ratio for typical households.
Instead, rental market conditions must be inferred indirectly. The relatively low statewide median sale price of 266,553 dollars, combined with rising home prices and a nontrivial share of homes selling above list price, suggests that while ownership remains more affordable than in many coastal states, barriers still exist for some households, particularly those with lower incomes or limited credit. In markets with growing employment, such as health care hubs and university towns, demand for multifamily rentals may be reinforced by this ownership hurdle.
For investors, these conditions mean that underwriting assumptions about rent levels and rent growth in West Virginia should be grounded in property specific and submarket level data, including current rent rolls, comparable property surveys, and management company insight, rather than relying on missing statewide public series. In lower cost markets, preserving affordability and focusing on stable occupancy can be as important as maximizing nominal rent levels.
Section 07Vacancy
Vacancy rates, both for residential and commercial properties, are critical to real estate performance, yet in West Virginia there is no open public data series in this environment that provides current, statewide vacancy metrics by asset class. The Census Housing Vacancy Survey provides national vacancy rates but does not deliver state level or metro level detail in the readable extracts available here. American Community Survey tables that would normally show rental and homeowner vacancy rates for West Virginia are not accessible. Commercial brokerage data on multifamily, office, retail, and industrial vacancy are proprietary.
As a result, this review cannot state the statewide rental vacancy rate in West Virginia, cannot report vacancy rates for office or industrial properties, and cannot provide time series data on how these rates have changed in recent years, and no official public numeric vacancy figure is available on those points in this environment. Any precise vacancy figures used in underwriting must come from private datasets, local broker surveys, or property level records rather than from public sources.
Nonetheless, qualitative insights can be drawn from the combination of housing and labor data. The moderate statewide unemployment rate of 4.2 percent in June 2026 suggests that most households who wish to work can find employment, which supports sustained demand for housing and reduces the risk of widespread nonpayment. The fact that 21.2 percent of home sales in May 2026 closed above list price implies that in parts of the state buyer demand is strong relative to the supply of homes, which is consistent with tighter vacancy for higher quality rentals in those areas.
At the same time, the slow overall growth in total nonfarm employment and the slight declines in sectors like mining, manufacturing, and leisure and hospitality indicate that some communities may face economic headwinds that raise vacancy risk. Properties in markets heavily dependent on a single employer or industry are particularly exposed if that anchor downsizes or closes.
For investors, the absence of public vacancy data reinforces the importance of due diligence at the property and submarket level. It is prudent to assume that vacancy can vary widely across West Virginia, with lower vacancy in university anchored towns and employment centers and higher vacancy in more remote or structurally declining communities.
Section 08Supply Pipeline
The supply pipeline for residential and commercial real estate in West Virginia consists of new construction, substantial rehabilitations, and adaptive reuse projects. Comprehensive data on units permitted and completed statewide, or on square footage of new commercial space, are not available here in a usable format from public sources. Local permit databases and Census Building Permits Survey tables are either not accessible or not easily parsed for West Virginia in this environment.
The West Virginia Housing Development Fund, which is the state housing finance agency, describes its mission as creating safe, stable, affordable housing that strengthens communities across the state. It states that it offers low interest mortgages for low and moderate income homebuyers and helps real estate developers access financing for affordable multifamily rental housing developments. The agency notes that it is the largest servicer of West Virginia based loans in the state. However, the publicly visible overview does not include numeric counts of units financed or a list of current multifamily projects under construction.
An indirect indicator of construction activity is the statewide construction employment data from the Bureau of Labor Statistics. As noted earlier, construction employment in West Virginia was 36.3 thousand jobs in June 2026, down modestly from 37.6 thousand in January on a month to month basis but up 3.7 percent compared with June 2025. This year over year growth in construction jobs suggests that a modest amount of building activity is underway, even as overall nonfarm employment growth remains subdued.
For investors, this means that supply risk in West Virginia is likely to be localized. Some metropolitan areas and corridors may see meaningful additions of multifamily units or commercial space, particularly where the Housing Development Fund and private developers are active, while other regions may have little new construction. Without a statewide inventory of projects, investors should review local planning and permitting records, talk with regional lenders and developers, and cross check employment in construction related sectors to gauge how much new supply will compete with a given asset over the hold period.
Section 09Single Family Homes
Single family homes are a core part of the West Virginia housing landscape, serving both owner occupants and investors pursuing single family rental strategies. The statewide Redfin data described earlier encompass all home types, but in many West Virginia communities single family detached homes represent a large share of transactions, so the median sale price of 266,553 dollars in May 2026 provides a reasonable gauge of pricing for typical houses.
Compared with the national median sale price of 398,771 dollars, West Virginia's median is lower by more than 130,000 dollars. This gap reflects both lower land costs and construction costs and the economic reality that household incomes in West Virginia are generally lower than the national average, even though this review cannot quantify that difference. The 4.5 percent year over year increase in the median sale price indicates that single family home values have been appreciating at a healthy pace, outpacing the 2.0 percent national price growth reported by Redfin over the same period.
The increase in the number of homes for sale to 5,801 statewide in May 2026, up 1.6 percent year over year, suggests that supply is expanding modestly but has not overwhelmed demand. The fact that 21.2 percent of homes sold above list price, with that share rising 3.7 percentage points over the year, implies that in many submarkets buyers are still competing for desirable properties and that sellers retain some pricing power.
For investors considering single family rentals, these patterns have several implications. First, the lower entry price point relative to national averages makes it easier to acquire diversified portfolios of homes with less capital per door, which can be attractive for income oriented strategies. Second, the combination of modest price appreciation and healthy buyer competition suggests that some assets may generate cash flow and, in certain locations, appreciation over a medium term hold period, particularly in growing areas near employment centers, universities, and interstate corridors, though neither cash flow nor gains is assured. Third, because incomes are lower and economic growth is modest in many parts of the state, rent and price growth assumptions should be conservative, with careful attention to tenant credit quality and the depth of the local demand pool.
Single family investors should also recognize that performance will vary sharply by location. Homes in metro areas like Charleston, Huntington, Morgantown, and the Eastern Panhandle region near Washington, DC are likely to experience different demand and liquidity conditions than properties in more remote or economically distressed counties.
Section 10Commercial Real Estate and Retail Centers
Commercial real estate in West Virginia spans office, industrial and logistics, and retail properties, including grocery anchored and neighborhood shopping centers. There is no open public dataset in this environment that provides current statewide vacancy rates, average asking rents, or capitalization rates by property type, nor is there a comprehensive public inventory of square footage by use. Major brokerage firms collect such data, but their reports are proprietary and not accessible here.
Nevertheless, the Bureau of Labor Statistics sector employment data and West Virginia's industry mix provide a framework for understanding demand drivers. Trade, transportation, and utilities employed 121.3 thousand people statewide in June 2026, with employment down only 0.2 percent over the prior year. This sector, which includes wholesale and retail trade as well as warehousing and distribution, underpins demand for retail space, warehouses, and logistics facilities. The relative stability of employment in this sector suggests that while some communities may struggle with retail consolidation or online shopping competition, others, particularly those near interstate highways and distribution corridors, may maintain steady industrial and service demand.
Professional and business services, with 73.1 thousand jobs in June 2026 and 1.1 percent year over year growth, and financial activities, with 25.9 thousand jobs and 0.4 percent growth, support demand for office space, although at a smaller scale than in larger states. Education and health services, which employed 148.1 thousand workers and grew 2.3 percent over the year, are key drivers of demand for medical office buildings, clinics, and support space. In metropolitan Charleston, the June 2026 employment figures show 24.9 thousand jobs in education and health services and 12.9 thousand in professional and business services, which help to anchor the local office, medical, and support real estate markets.
Retail centers in West Virginia are shaped by the interplay of local incomes, population density, and tourism. Grocery anchored neighborhood centers and community shopping centers in stable residential areas often provide resilient cash flows, especially where they serve as essential service hubs. Smaller main street retail districts in towns and cities may benefit from tourism, university activity, or downtown employment, but they are also exposed to changing consumer preferences and online shopping.
Industrial and logistics properties are influenced by the state's geography and transport links. West Virginia's location along major east west and north south corridors, combined with relatively low land costs, can support distribution and manufacturing facilities that serve broader regional markets. The modest year over year decline in statewide manufacturing employment and the relative stability of trade and transportation jobs suggest that industrial demand is neither booming nor collapsing, but rather adjusting gradually to broader economic trends.
For investors, the lack of public vacancy and rent data means that each commercial acquisition in West Virginia must be underwritten based on current lease rolls, tenant financial strength, and detailed local market intelligence. Assets aligned with growing sectors such as health care, education, and logistics and located near strong transportation infrastructure are more likely to offer durable income streams, while properties dependent on shrinking industries or in locations with limited demand drivers warrant more caution and higher return hurdles.
Section 11Transactions and Capital Markets
Public information on commercial real estate transaction volumes, capitalization rates, and pricing trends specific to West Virginia is not available in this environment from open sources. Data from institutional transaction databases, mortgage market reports, and brokerage research that would typically provide such metrics are proprietary. As a result, this review cannot state the total value of commercial real estate transactions in West Virginia over the past year, average capitalization rates by property type, or the volume of multifamily and single family rental portfolio trades, and no official public numeric figure is available on those points in this environment.
The residential sales data from Redfin show that the for sale housing market in West Virginia remains active, with 5,801 homes for sale in May 2026 and a median sale price of 266,553 dollars, up 4.5 percent year over year. The fact that 21.2 percent of sales closed above list price indicates that at least some segments of the market continue to attract strong bids, implying that both local and external capital are willing to invest in West Virginia housing.
At the national level, the higher interest rate environment that has prevailed since 2022 affects all states, including West Virginia. Higher borrowing costs compress debt service coverage for income producing properties and can lead to lower leverage and lower prices than in the prior low rate era. For smaller markets like those in West Virginia, liquidity can be thinner, and the pool of buyers for larger assets more limited, which makes asset quality, tenant credit, and sponsor experience particularly important in securing favorable terms.
Investors should therefore expect capital markets for West Virginia real estate to be more bespoke and relationship driven than in major gateway markets. Pricing, cap rates, and leverage will vary significantly by asset type, location, and tenant mix, and in the absence of comprehensive public transaction data, each deal should be evaluated on its own merits and in light of current financing conditions.
Section 12Taxes
Tax policy in West Virginia influences the net returns of real estate investments, but this review has limited direct quantitative information on specific state and local tax rates from public online sources in this environment. The West Virginia Tax Division's website is accessible and identifies itself as the state's tax authority, but the readable extract encountered here presents only a message about opening a link to another organization and does not include numeric information on tax rates, bases, or collections.
In practice, West Virginia, like other states, relies on a combination of personal income taxes, corporate income taxes, sales and use taxes, and property taxes administered at the county level, along with various fees and excise taxes. Property taxes are a critical component for real estate investors, as they directly affect net operating income. Because the state's public site content visible here does not specify the effective property tax rates or assessment formulas, and given that this review does not estimate figures, it does not state a statewide effective property tax rate or sales tax rate, and no official public numeric rate is available on those points in this environment.
Investors considering assets in West Virginia should therefore obtain up to date tax information directly from county assessor offices, local ordinances, and professional tax advisors. Careful review of assessment histories, mill rates, and potential changes in valuation is essential, especially when evaluating value add strategies or assets that have not been reassessed for some time.
Section 13Insurance
Insurance is a central operating expense and risk management tool for real estate assets. The West Virginia Offices of the Insurance Commissioner maintains an Insurance Education Center that provides consumer insurance information on auto, health, home, and life insurance. The office's materials emphasize educating insurance consumers in the state and provide guidance and documents under topic tabs for different insurance lines. While these resources confirm that West Virginia has an active regulatory framework overseeing insurance carriers and products, the publicly visible educational content does not include numeric data on average premiums, loss ratios, or coverage costs for property insurance.
Beyond state oversight, national programs such as the National Flood Insurance Program, administered through FEMA, shape coverage for flood risks where applicable. In addition, earthquake, wind, and other hazard coverages are provided through private carriers operating under state regulation. Because no statistical series on premiums or claims by county or property type are accessible in this environment, this review cannot quantify insurance costs for residential or commercial properties in West Virginia, and no official public numeric figure is available on that point in this environment.
From an investor's perspective, insurance in West Virginia is influenced by the state's exposure to perils such as flooding, severe storms, and landslides in mountainous terrain. Premiums and deductibles may be lower than in coastal states with high hurricane exposure but can still be significant for properties in flood prone valleys or near rivers. Insurance availability and pricing should therefore be treated as an asset specific factor, with investors obtaining current quotes and considering scenarios in which premiums or deductibles increase during the hold period.
Section 14Landlord Tenant and Regulatory Environment
West Virginia's landlord and tenant environment is generally less regulated than those of large coastal states that have extensive rent control and tenant protection statutes. There is no statewide rent control regime analogous to those found in some northeastern or western jurisdictions. Instead, residential leasing is governed by state landlord tenant law and local building codes, with standard obligations around habitability, notice, and eviction procedures.
Because this review does not pull from a specific public dataset on legal provisions, it does not enumerate particular statutory requirements or recent legislative changes. It also does not attempt to quantify the proportion of units subject to any local housing programs or subsidies beyond the activities of the West Virginia Housing Development Fund.
For investors, the key implication is that West Virginia presents a comparatively flexible operating environment for landlords, with fewer structural constraints on rent setting and lease terms than in highly regulated markets. However, that flexibility is balanced by the need to manage tenant credit risk and maintain strong property management practices, particularly in lower income areas. Engaging local counsel to understand the details of eviction law, security deposit rules, and code enforcement remains essential before acquiring or repositioning residential assets.
Section 15Infrastructure
Infrastructure conditions and investments influence real estate values and operating performance across West Virginia. The state's mountainous terrain makes transportation infrastructure, including interstate highways, rail lines, and bridges, particularly important. While this review does not have access to numeric data on lane miles, bridge counts, or capital spending, it is clear that major corridors such as Interstate 64, Interstate 77, and Interstate 79 connect West Virginia's cities to neighboring states and larger economic centers.
The West Virginia Division of Economic Development highlights prime location and a world class workforce as part of the state's advantages, positioning West Virginia as a place to build and grow businesses in the eastern United States. The site also notes a pro business climate and extensive industrial and business development programs, along with an Office of Broadband and various workforce and incentive initiatives. These features underscore that state and local governments are actively investing in infrastructure and business support to make West Virginia more competitive.
For real estate investors, the practical implications include the importance of access to interstate interchanges, rail spurs, and broadband infrastructure in evaluating industrial and office properties, and the significance of road quality, transit access where available, and utility reliability for residential and retail assets. Infrastructure improvements can unlock new development opportunities, while deferred maintenance in certain areas can pose hidden risks.
Section 16Climate and Physical Risks
West Virginia's climate and physical risks are shaped by its geography and hydrology. FEMA emphasizes that floods occur naturally and can happen almost anywhere, including areas not immediately adjacent to bodies of water, and that heavy rains, poor drainage, and nearby construction projects can increase flood risk. FEMA's flood maps classify any place with at least a one percent annual chance of flooding as high risk, meaning such areas have at least a one in four chance of flooding during a thirty year mortgage period. Although this review does not access parcel specific flood maps for West Virginia, many of the state's communities are located along rivers and streams that can experience flooding during heavy precipitation events.
The National Centers for Environmental Information maintains one of the most significant environmental data archives in the world and provides climate, coastal, oceanographic, and geophysical data through multiple access platforms. For West Virginia, long term climate trends include patterns in temperature and precipitation, as well as the frequency and intensity of extreme weather events such as heavy rainfall, storms, and droughts. While this review does not quantify those trends for the state, such changes can influence flood, landslide, and erosion risks over time.
West Virginia's steep terrain and history of mining also contribute to physical risk through landslides and ground instability in certain areas. Properties located on slopes, near old mine works, or in narrow valleys require careful geotechnical assessment. In addition, winter weather and freeze thaw cycles can impact building envelopes, roads, and utility infrastructure.
For investors, integrating climate and physical risk analysis into due diligence is crucial. This includes reviewing FEMA flood maps for specific properties, understanding local drainage patterns, evaluating building codes and any history of flooding or landslides, and considering how climate change may alter risk profiles over an investment horizon. Insurance terms, including coverage limits, exclusions, and deductibles, should be reviewed in light of these hazards.
Section 17Opportunities
Several opportunity themes stand out for accredited investors evaluating West Virginia.
First, the state's relatively low home prices, with a median sale price of 266,553 dollars in May 2026, create entry points that are significantly more affordable than the national median of 398,771 dollars. This cost advantage can support strategies that acquire and improve single family and small multifamily properties, particularly in markets with stable employment and access to amenities.
Second, the labor data reveal growth in sectors that generate steady demand for housing and certain types of commercial space. Education and health services employment grew 2.3 percent statewide over the twelve months ending June 2026, reaching 148.1 thousand jobs, while professional and business services employment rose 1.1 percent to 73.1 thousand jobs. These sectors underpin demand for housing near major hospitals, clinics, universities, and service hubs, as well as for medical office and support facilities.
Third, construction employment growth of 3.7 percent year over year in June 2026 indicates that some new development and renovation activity is underway, which can create opportunities for investors to participate in or acquire newly built or repositioned assets. In markets where new supply remains limited relative to demand, well conceived projects may perform relatively well, though returns are not assured.
Fourth, the state's efforts to promote a pro business climate, including incentive programs and economic development initiatives for industries such as aerospace, automotive, chemicals and polymers, food and agriculture, forest products, fulfillment and distribution, life sciences, manufacturing, metals, and technology, point to long term opportunities in industrial and logistics real estate. Sites near targeted industrial clusters or designated incentive zones may benefit from incremental investment and job creation.
Finally, the West Virginia Housing Development Fund's focus on affordable housing finance suggests that developers and owners of income restricted or workforce housing can access specialized financing tools. While this review does not list specific programs or unit counts, partnerships with the Housing Development Fund can enhance the feasibility of affordable multifamily projects that meet program criteria.
Section 18Risks
Balanced against these opportunities are several material risks.
One risk is the modest overall pace of job growth. Total nonfarm employment increased only 0.3 percent year over year as of June 2026, and key legacy sectors such as mining and logging, manufacturing, and leisure and hospitality have experienced employment declines. If growth in education, health, and professional services does not fully offset further weakness in energy or heavy industry, some communities could see stagnant or declining demand for both housing and commercial space.
A second risk is demographic. Although current population figures are not accessible in this document, long term patterns suggest that some parts of West Virginia have struggled with population loss or slow growth. In such areas, property values and rents may be constrained, and vacancy risk may be higher, particularly for older or less well located assets.
Third, data limitations themselves pose a risk. The inability to access current census and American Community Survey data for West Virginia and the absence of public rent and vacancy series mean that investors who rely solely on public datasets may lack crucial information on income distribution, rent levels, and household characteristics. This increases reliance on local knowledge and proprietary data sources and makes thorough on the ground due diligence more important.
Fourth, physical and climate risks, including flooding, landslides, and severe weather, can affect asset performance and long term viability. Properties in flood prone valleys or on unstable slopes may face higher insurance costs, disruption during events, and potential capital expenditures for mitigation. As FEMA notes, areas with a one percent annual flood risk have a one in four chance of flooding during a typical thirty year mortgage period, which is a material concern for long term investors.
Finally, capital markets in smaller states like West Virginia can be less liquid and more sensitive to changes in national financing conditions. In a higher interest rate environment, refinancing risk is greater, and exit options for larger or more complex assets may be fewer. Investors should factor in a premium for illiquidity and be prepared for longer hold periods or more flexible exit strategies.
Section 19Investor Implications
For accredited investors, West Virginia offers an opportunity to gain exposure to a lower cost, yield oriented real estate market that is gradually transitioning its economic base. The state's relatively low home prices and moderate price growth, combined with sector level job expansion in health care, education, and professional services, can support income producing strategies in residential and selected commercial assets, though income and returns are not assured.
At the same time, the modest pace of overall employment growth, the softness in mining, manufacturing, and leisure and hospitality, and the limited availability of public data on income, rents, and vacancy require a cautious and selective approach. Successful investment in West Virginia will depend on granular understanding of specific metros and corridors, careful tenant and sponsor selection, and realistic underwriting that emphasizes in place cash flow over speculative appreciation.
Investors should favor assets and submarkets that align with identifiable economic anchors, such as major hospitals, universities, and industrial corridors, and that benefit from infrastructure and incentive programs highlighted by the state's economic development authorities. They should also integrate climate and physical risk assessment, insurance cost analysis, and scenario testing for interest rates and refinancing conditions into their decision making.
In portfolio construction, West Virginia exposure is likely to serve best as a complement to holdings in larger, faster growing markets, providing diversification and potentially higher current yields, while acknowledging that liquidity and growth prospects may be more constrained.
Section 20Conclusion
West Virginia's real estate landscape reflects a state in gradual transition. Public labor statistics from the Bureau of Labor Statistics show a stable but slow growing job market, with education and health services and professional and business services expanding while mining, manufacturing, and leisure and hospitality face headwinds. Redfin's housing data reveal a for sale market with relatively low entry prices in national context but with solid price growth and a meaningful share of transactions closing above list price.
At the same time, significant data gaps in census, income, rent, and vacancy statistics mean that investors cannot rely solely on standard public datasets to form a complete picture of the market. Instead, they must blend the available public information with local intelligence, property level data, and professional advice.
For accredited investors willing to engage at that level of detail, West Virginia can offer opportunities in multifamily, single family rentals, and select commercial assets tied to resilient sectors and locations. However, success requires careful selection, conservative underwriting, and awareness of the economic, demographic, and physical risks outlined above, and no particular outcome is assured.
Sources
- United States Bureau of Labor Statistics, West Virginia Economy at a Glance. Statewide seasonally adjusted labor force, employment, unemployment, unemployment rate, total nonfarm employment, and sector employment with twelve month percent changes for January through June 2026, extracted August 7, 2026.
- United States Bureau of Labor Statistics, Charleston, West Virginia Economy at a Glance. Metropolitan not seasonally adjusted labor force, employment, unemployment, unemployment rate, total nonfarm employment, and sector employment with twelve month percent changes for January through June 2026, extracted August 7, 2026.
- Redfin, West Virginia housing market overview. Statewide median sale price across all home types of 266,553 dollars with 4.5 percent year over year increase in May 2026, 5,801 homes for sale with 1.6 percent year over year increase in May 2026, and 21.2 percent of homes sold above list price with a 3.7 percentage point year over year increase in May 2026, extracted August 7, 2026.
- Redfin, United States housing market overview. National median sale price across all home types of 398,771 dollars with 2.0 percent year over year increase in May 2026, 1,483,839 homes for sale with 0.7 percent year over year increase in May 2026, and 24.9 percent of homes sold above list price with a 0.083 percentage point year over year decrease in May 2026, plus national migration trends, extracted August 7, 2026.
- United States Census Bureau, State Population Totals and Components of Change 2020 to 2025, NST EST2025 ALLDATA. National population estimate of 341,784,857 people as of July 1, 2025, total population change of 1,781,060 between 2024 and 2025, composed of a natural increase of 518,858 people from 3,620,461 births and 3,101,603 deaths and net international migration of 1,262,202 people; West Virginia state row not visible in truncated extract, referenced for national demographic context, extracted August 7, 2026.
- United States Census Bureau, QuickFacts, West Virginia. Attempts to access the state profile returned a Cloudflare blocking page, preventing retrieval of population, income, and housing statistics; referenced to document data access constraints, accessed August 7, 2026.
- United States Department of Housing and Urban Development, FY 2024 Fair Market Rents Documentation System, geography selection interface. Page provides menus to select a state, county, or metropolitan Fair Market Rent area but does not expose dollar rent values for West Virginia in the readable text in this environment; referenced to explain absence of public rent figures, accessed August 7, 2026.
- West Virginia Housing Development Fund, homepage. Describes the Fund as West Virginia's state housing finance agency, providing low interest mortgages for low and moderate income homebuyers and financing for affordable multifamily rental housing developments, and notes that the Fund is the largest servicer of West Virginia based loans; referenced for affordable housing and supply context, accessed August 7, 2026.
- Federal Emergency Management Agency, Flood Maps. Narrative description of flood risks, explanation that flood maps show areas with a one percent or greater annual chance of flooding, and statement that such high risk areas have at least a one in four chance of flooding over a thirty year mortgage, accessed August 7, 2026.
- National Centers for Environmental Information, homepage. Description of the agency's role in maintaining a significant environmental data archive and providing access to climate, coastal, oceanographic, and geophysical data; referenced for climate and hazard data context, accessed August 7, 2026.
- West Virginia Offices of the Insurance Commissioner, Insurance Education Center. Consumer insurance information resource describing educational content on auto, health, home, and life insurance for West Virginia residents and the office's role in helping insurance consumers; referenced for insurance regulatory context, accessed August 7, 2026.
- West Virginia Division of Economic Development, homepage. Overview describing West Virginia as a place to build and grow a business in the eastern United States, highlighting affordability, prime location, a pro business climate, quality of life, a world class workforce, and thriving industries, and listing incentives and programs; referenced for economic development and industry context, accessed August 7, 2026.
- West Virginia Tax Division, main page. Gateway page identifying the West Virginia Tax Division and presenting a message about opening a link to another organization, without exposing numeric tax rates; referenced to note limited public tax rate detail in this environment, accessed August 7, 2026.