In brief · summary: Wisconsin
Wisconsin State Real Estate Market Review
Section 01Executive Summary
Wisconsin's real estate landscape is shaped by a diversified upper Midwest economy, stable but slow job growth, and a for sale housing market that has seen stronger recent price appreciation than the nation as a whole. Bureau of Labor Statistics data show that statewide total nonfarm employment was 3,041.0 thousand jobs in June 2026, seasonally adjusted, with a twelve month change of 0.1 percent. The civilian labor force that month was 3,134.8 thousand people, with 3,030.1 thousand employed and 104.7 thousand unemployed, for an unemployment rate of 3.3 percent. Over the first half of 2026, unemployment in Wisconsin ranged between 3.3 and 3.5 percent, indicating a relatively tight labor market.
At the metropolitan level, the Madison area provides a useful example of an anchor market. In June 2026, the Madison metropolitan area had a civilian labor force of 409.1 thousand people and employment of 396.9 thousand, for an unemployment rate of 3.0 percent. Total nonfarm employment in Madison was 429.5 thousand jobs in June 2026, after running between 422.6 and 431.5 thousand jobs from January through May. These figures underscore the importance of government, education, technology, and health care employment around the state capital.
On the housing side, Redfin reports that the statewide median sale price across all home types in Wisconsin was 351,252 dollars in May 2026, up 5.7 percent from May 2025. There were 22,647 homes for sale statewide in May 2026, 5.8 percent more than a year earlier, and 36.9 percent of homes sold above list price, a 0.65 percentage point decrease year over year. Compared with the United States overall, where Redfin reports a May 2026 median sale price of 398,771 dollars, a 2.0 percent year over year increase, and 24.9 percent of homes selling above list price, Wisconsin has slightly lower prices but stronger recent price growth and a higher share of above list transactions, pointing to relatively competitive buyer conditions.
This review cannot provide current population or income figures for Wisconsin because access to Census Bureau QuickFacts is blocked in this environment by a Cloudflare security screen and the Wisconsin Department of Administration's population estimate spreadsheets are available only as Excel files that cannot be parsed here. Similarly, there are no public, nonproprietary series accessible for statewide multifamily rents, vacancy rates, or commercial real estate cap rates. Those gaps are noted explicitly and addressed with qualitative discussion where appropriate, while emphasizing that investors must supplement this review with proprietary data and local research.
For accredited investors, Wisconsin offers a mix of stable cash flow markets in smaller cities and towns, growth oriented opportunities around Madison and select suburban corridors, and specialized plays in industrial and logistics tied to the state's manufacturing and distribution base. The sections that follow examine population and migration, the labor market, housing conditions, and the regulatory and physical environment, working within the available public data.
Section 02Population and Migration
This review cannot state a current population figure for Wisconsin because key public sources are not accessible in numeric form in this environment. The United States Census Bureau QuickFacts page for Wisconsin is blocked by a Cloudflare security page that states that access has been blocked, and does not expose any data. The Wisconsin Department of Administration's Demographic Services Center explains that it annually produces population estimates for Wisconsin counties and municipalities, with preliminary estimates released by August 10 and final estimates by October 10 each year, referencing January 1 as the estimate date. For January 1, 2025, the department links to several Excel workbooks containing county totals, municipal estimates, and components of change, but because these files are in spreadsheet format they cannot be parsed here to extract specific numbers.
As a result, this review does not provide a numeric statewide population for Wisconsin, does not quantify recent population growth, and does not break out age or household composition distributions, and no official public numeric population figure is available on those points in this environment. However, the presence of detailed county and municipal estimates and components of change files on the Wisconsin Department of Administration site indicates that state officials track births, deaths, domestic migration, and international migration closely, and that there is an institutional focus on granular demographic trends.
Migration patterns are visible indirectly through Redfin's national migration analysis. Redfin reports that between January and March 2026, 19 percent of homebuyers using its platform searched for homes in a different metropolitan area than their current one. The top five destination states for these movers were Florida, Arizona, South Carolina, Tennessee, and Nevada, and the top five origin states were California, New York, Illinois, Washington, and Massachusetts. Wisconsin does not appear on either the top inbound or top outbound state lists in this national ranking, which suggests that, in this dataset, Wisconsin is not one of the most prominent destinations or sources for interstate movers. That does not mean migration flows are trivial, but rather that they are more moderate and likely tied to regional dynamics within the upper Midwest.
For investors, the absence of accessible numeric population data and detailed migration statistics means demographic analysis must rely on other tools, including local school enrollment trends, utility connections, and proprietary demographic datasets. The available evidence points to Wisconsin as a relatively stable state in demographic terms, with some growth and higher income in metro areas like Madison and certain Milwaukee suburbs, and more gradual change in many smaller cities and rural communities.
Section 03Jobs and Economic Anchors
The Bureau of Labor Statistics provides the clearest current view of Wisconsin's economy. According to the Wisconsin Economy at a Glance table, the statewide civilian labor force in January 2026 was 3,121.2 thousand people, rising to 3,134.8 thousand by June 2026 on a seasonally adjusted basis. Employment over the same period moved from 3,017.8 thousand in January to 3,030.1 thousand in June. Unemployment ranged from 103.4 thousand to 110.1 thousand over those months, and the unemployment rate fluctuated between 3.3 and 3.5 percent.
Total nonfarm employment in Wisconsin was 3,030.4 thousand jobs in January 2026, 3,020.4 thousand in February, 3,019.8 thousand in March, 3,031.1 thousand in April, 3,038.6 thousand in May, and 3,041.0 thousand in June. The twelve month percent change in total nonfarm employment was negative 0.6 percent in January, February, and March, negative 0.3 percent in April, negative 0.1 percent in May, and positive 0.1 percent in June 2026. These figures indicate that statewide employment was essentially flat over the year, with a slight decline early in 2026 and a modest return to growth by June.
The table below summarizes key statewide labor market indicators for the first half of 2026.
| Month 2026 | Civilian labor force, thousands | Employment, thousands | Unemployment rate, percent | Total nonfarm employment, thousands | Twelve month change in total nonfarm employment, percent |
|---|---|---|---|---|---|
| January | 3,121.2 | 3,017.8 | 3.3% | 3,030.4 | -0.6% |
| February | 3,126.6 | 3,019.3 | 3.4% | 3,020.4 | -0.6% |
| March | 3,129.3 | 3,019.7 | 3.5% | 3,019.8 | -0.6% |
| April | 3,130.2 | 3,020.1 | 3.5% | 3,031.1 | -0.3% |
| May | 3,131.5 | 3,024.1 | 3.4% | 3,038.6 | -0.1% |
| June (preliminary) | 3,134.8 | 3,030.1 | 3.3% | 3,041.0 | 0.1% |
Sector level data show that some parts of the economy are growing while others are flat. In June 2026, mining and logging employment was 4.1 thousand jobs, the same as in January, with a twelve month percent change of 2.5 percent. Construction employment was 152.7 thousand jobs in June 2026, compared with 152.9 thousand in January and 154.8 thousand in May, and the twelve month percent change in construction employment was 6.2 percent in May and 4.6 percent in June. Manufacturing, the largest goods producing sector in the state, employed 456.7 thousand people in June 2026, down 0.4 percent over the year, while trade, transportation, and utilities employed 536.8 thousand people, down 2.1 percent year over year. Education and health services, at 506.2 thousand jobs in June, grew 1.9 percent over the year, and government employment stood at 409.8 thousand jobs, down 1.6 percent. These figures suggest that construction and health care are modestly above year earlier levels, supporting ongoing residential and commercial activity, while manufacturing and trade have softened slightly.
In the Madison metropolitan area, which provides a more detailed view of an important regional hub, the BLS Madison Economy at a Glance table shows that total nonfarm employment was between 422.6 and 431.5 thousand jobs from January through May 2026 and stood at 429.5 thousand in June, all on a not seasonally adjusted basis. Mining, logging, and construction in Madison rose from 20.8 thousand jobs in January to 22.9 thousand in June, with twelve month growth rates between 3.6 and 6.1 percent over the period. Manufacturing employment in Madison held near 36.2 thousand jobs in each month from January through May 2026, with a value of 36.3 thousand in March.
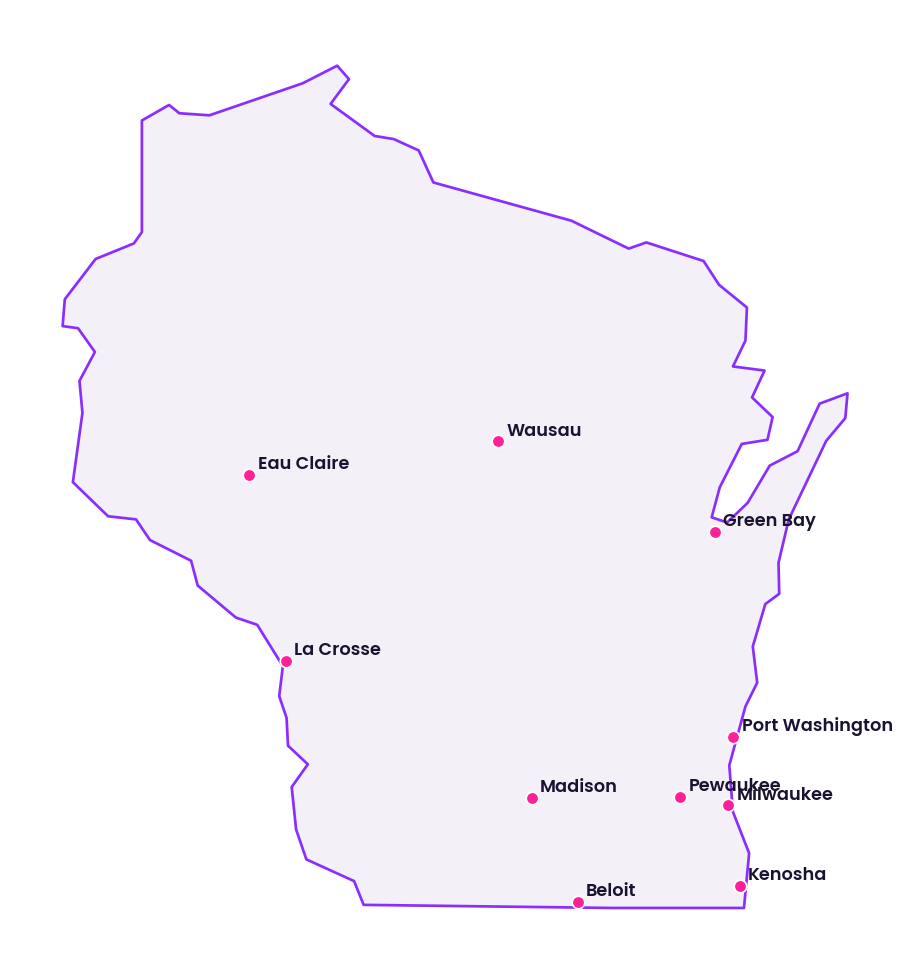
These labor data underline a few important anchors. Madison's role as the state capital and home to a large research university supports government, higher education, technology, and health care employment. Other metros such as Milwaukee and Green Bay anchor manufacturing, port activity, and logistics, while smaller cities like Eau Claire, La Crosse, and Wausau combine regional services with industry and agriculture. For investors, this mix suggests that Wisconsin is not a boom economy but offers diversified employment across sectors that support both multifamily and commercial real estate demand.
Section 04Income
In this environment, there is no accessible public series that provides current median household income or per capita income for Wisconsin in numeric form. The Census Bureau QuickFacts page that would normally provide these figures is blocked behind a Cloudflare security screen, and the American Community Survey tables that detail income distributions by state and by metropolitan area are not available in a readable form. The Bureau of Economic Analysis publishes personal income and earnings data by state, but its interactive tables do not yield specific numeric values in the text extract obtainable here.
Because of these constraints, this review does not state a statewide median household income for Wisconsin, does not provide per capita income, and does not compare Wisconsin income numerically with national averages, and no official public numeric income figure is available on those points in this environment. Instead, it notes qualitatively that Wisconsin's income profile reflects a combination of manufacturing, agriculture, public sector, health care, and knowledge economy wages, with relatively higher incomes in metro areas such as Madison and certain Milwaukee suburbs, and more modest incomes in many rural and small town areas.
For investment underwriting, this lack of public income data means that assumptions about rent levels, rent to income ratios, and tenant purchasing power must be based on proprietary demographic datasets, lender and broker market reports, and property level screening information. It is prudent to segment income expectations by region within Wisconsin, recognizing that tenant and buyer profiles in Madison's technology and public sector influenced economy differ from those in manufacturing oriented smaller cities or in agricultural regions.
Section 05Housing and Multifamily
Statewide housing conditions are clearest in the Redfin data for Wisconsin. Redfin reports that the median sale price across all home types in Wisconsin was 351,252 dollars in May 2026. This represents an increase of 5.7 percent compared with May 2025. In the same month, there were 22,647 homes for sale statewide, a 5.8 percent increase year over year. Housing demand remains strong: 36.9 percent of homes sold above list price in May 2026, although that share declined by 0.65 percentage points compared with the previous year. These figures suggest that buyer competition persists but has eased slightly relative to 2025.
In national context, Redfin's United States housing market overview shows a median sale price of 398,771 dollars across all home types in May 2026, up 2.0 percent year over year. There were 1,483,839 homes for sale nationwide, a 0.7 percent increase from a year earlier, and 24.9 percent of homes sold above list price, with a small decline of 0.083 percentage points in that share. Wisconsin's median sale price is therefore lower than the national median by about 47,500 dollars, but its recent price growth of 5.7 percent outpaces the national 2.0 percent, and its above list sale share of 36.9 percent is significantly higher than the national 24.9 percent.
The table below compares key May 2026 housing metrics for Wisconsin and the United States.
| Geography | Metric scope | Median sale price, all home types, dollars | Year over year change in median sale price, percent | Homes for sale, count | Year over year change in homes for sale, percent | Share of homes sold above list price, percent | Change in share sold above list, percentage points |
|---|---|---|---|---|---|---|---|
| Wisconsin | May 2026 | 351,252 | 5.7% | 22,647 | 5.8% | 36.9% | -0.65% |
| United States | May 2026 | 398,771 | 2.0% | 1,483,839 | 0.7% | 24.9% | -0.083% |
Redfin also highlights that several Wisconsin cities are experiencing particularly rapid home price growth. In its list of the top ten Wisconsin metros with the fastest growing sales price, Caledonia shows year over year price growth of 38.9 percent, Mequon 30.3 percent, Wausau 25.5 percent, Port Washington 21.8 percent, Beloit 19.6 percent, Kenosha 18.9 percent, Fond du Lac 18.2 percent, Middleton 17.6 percent, Pewaukee 17.2 percent, and Fitchburg 16.3 percent. While these figures do not provide median prices for each city, they indicate that pockets of the state, including suburban Milwaukee communities and regional centers, are experiencing double digit appreciation.
From a multifamily perspective, these statewide and city level trends matter because rising for sale prices and competitive bidding conditions can push households toward renting, particularly younger households and those in moderate income ranges. The Wisconsin Housing and Economic Development Authority notes that since 1972 it has financed more than 88,700 affordable rental units across the state and helped more than 141,800 families purchase a home, along with more than 29,280 small business and agricultural loan guarantees. The size of that multifamily portfolio underscores the importance of rental housing in Wisconsin's overall housing ecosystem.
Because there is no public series here that separates multifamily asset prices or cap rates from single family home values, multifamily investors must treat the Redfin data as an indicator of general housing demand and price momentum rather than a direct measure of apartment values. The combination of stronger than national price growth and a high share of homes selling above list suggests that tenant demand is likely robust in many markets, especially those with strong employment bases, but also that acquisition yields may be compressed in high growth submarkets. Careful submarket selection and close analysis of rent to income and occupancy trends are essential.
Section 06Rents
There is no current statewide public series in this environment that provides numeric rental data for Wisconsin. The HUD fiscal year 2024 Fair Market Rent documentation interface shows only prompts to select a state, county, or metropolitan Fair Market Rent area and does not display dollar rent values in its readable text. American Community Survey tables that contain median gross rent and rent burden figures for Wisconsin are not accessible here, and proprietary rent indices from private firms are outside the scope of this review.
As a result, this review does not state a statewide median rent for Wisconsin, does not quote rent levels or rent growth for specific metropolitan areas, and does not quantify rent differentials between Wisconsin and national averages, and no official public numeric rent figure is available on those points in this environment. It also does not provide rent distributions by bedroom count or by building type.
Qualitatively, the combination of relatively strong statewide home price growth of 5.7 percent year over year as of May 2026, increased housing inventory, and a high share of homes selling above list suggests that housing costs in many parts of Wisconsin are increasing. In markets where incomes are growing more slowly than housing costs, rental demand can be strong as potential buyers delay ownership or choose renting for affordability reasons. In higher growth submarkets such as Madison and certain Milwaukee area suburbs, multifamily and single family rentals likely benefit from both demand from local workers and from households moving within the state.
Because public rent data are not available, investors must base rent assumptions on primary research. That includes current rent rolls, competitive property surveys, broker opinions, and, where possible, rental listings data from multiple listing services or other platforms. Scenario analysis should test how properties perform under slower rent growth or flat rents, as well as how rent levels interact with tenant incomes and operating costs.
Section 07Vacancy
There is no accessible, official public dataset here that reports current multifamily or commercial vacancy rates for Wisconsin as a whole or for its major metropolitan areas. The Census Housing Vacancy Survey provides national level vacancy figures, but not state specific or metropolitan statistics in the extracts available. American Community Survey detailed housing tables that show vacant units by tenure are not readable in this environment, and commercial vacancy metrics for office, industrial, and retail real estate are generally tracked by brokerage firms and proprietary data providers rather than by federal or state agencies.
Consequently, this review does not provide a numeric statewide multifamily vacancy rate, does not quantify vacancy for single family rentals, and does not list vacancy percentages for office, industrial, or retail properties in Wisconsin, and no official public numeric vacancy figure is available on those points in this environment. It also does not present historical vacancy trends or absorption rates by property type.
Instead, vacancy must be inferred qualitatively from broader indicators. Statewide unemployment in Wisconsin between January and June 2026 remained low, between 3.3 and 3.5 percent, and total nonfarm employment returned to slight year over year growth by June after small declines earlier in the year. These labor conditions are consistent with generally healthy occupancy in stabilized residential properties, especially in metros with diverse employment bases.
On the for sale side, the fact that 36.9 percent of Wisconsin homes sold above list price in May 2026, a higher share than the national 24.9 percent, suggests that buyer demand is strong enough to prevent significant oversupply in many local housing markets. For rental properties, that likely translates into relatively low vacancy in well located and well managed assets, though individual submarkets and property types may diverge.
In the commercial realm, Wisconsin's broader economic mix and the national shift toward remote and hybrid work imply that some office submarkets, particularly older buildings in less central locations, may experience elevated vacancy, while industrial and logistics properties tied to manufacturing, distribution, and e commerce may see tighter occupancy. Without public vacancy data, investors must rely on asset level rent rolls, leasing histories, and proprietary market reports to quantify these conditions.
Section 08Supply Pipeline
Assessing the supply pipeline for Wisconsin real estate requires data on building permits, construction starts, and projects under construction. In this environment, there is no statewide public series in text form that lists current multifamily or commercial unit counts under construction by market, and detailed permit tables are typically provided in spreadsheet or database formats that are not readable here.
However, employment in construction provides a useful proxy for overall building activity. According to the Wisconsin Economy at a Glance table, construction employment statewide was 152.9 thousand jobs in January 2026, 153.6 thousand in February, 151.8 thousand in March, 151.8 thousand in April, 154.8 thousand in May, and 152.7 thousand in June. The twelve month percent change in construction employment was 6.3 percent in January, 7.0 percent in February, 4.5 percent in March, 4.8 percent in April, 6.2 percent in May, and 4.6 percent in June. These figures indicate that construction employment in Wisconsin has been running several percentage points above year earlier levels throughout the first half of 2026, in a range between roughly 4 and 7 percent, which supports ongoing residential and commercial development even as overall nonfarm employment has been close to flat.
In the Madison metropolitan area, mining, logging, and construction employment rose from 20.8 thousand jobs in January 2026 to 22.9 thousand in June, with twelve month growth rates between 3.6 and 6.1 percent. This suggests an active development environment in and around the state capital, likely encompassing residential, institutional, and commercial projects.
Because there is no project level or unit count data here, this review cannot state how many multifamily units, single family lots, or square feet of office, industrial, or retail space are currently under construction or planned in Wisconsin. Investors must therefore obtain pipeline information through local planning departments, permitting records, and proprietary development databases. The employment data still help frame the environment: construction activity is expanding rather than contracting, which suggests that new supply is entering the market, though the pace is moderate rather than explosive, which can be compatible with balanced conditions if demand remains steady.
Section 09Single Family Homes
Single family homes are a foundational asset class for Wisconsin's housing market. Redfin's statewide metrics, while covering all home types, are heavily influenced by single family detached and attached homes, since these typically make up the majority of for sale inventory.
As noted earlier, Redfin reports that Wisconsin's median sale price across all home types was 351,252 dollars in May 2026, up 5.7 percent from May 2025. The 22,647 homes for sale statewide in May 2026 represent a 5.8 percent increase in inventory compared with a year earlier. The share of homes selling above list price, at 36.9 percent, though slightly lower than the prior year, still indicates frequent multiple offer situations and seller leverage in many transactions.
When compared to the national median sale price of 398,771 dollars and national price growth of 2.0 percent, Wisconsin's single family market appears more affordable on a dollar basis but more dynamic in terms of appreciation. This combination can make Wisconsin attractive to both in state and out of state buyers seeking value relative to coastal markets, especially in metros and suburbs with strong schools and amenities.
The list of Wisconsin metros with the fastest growing sales prices underscores that certain communities are experiencing particularly strong demand. Caledonia's 38.9 percent year over year price growth, Mequon's 30.3 percent, and Wausau's 25.5 percent highlight that both suburban Milwaukee and regional center markets are seeing large price gains. Investors in single family rentals and build to rent communities in these areas may benefit from appreciation, but they also face higher acquisition costs and the risk that price and rent growth could slow in future years; past appreciation is not an indication of future results.
From a single family rental perspective, rising for sale prices can increase demand for rental housing among households who cannot or choose not to buy at current valuations. In Wisconsin, markets like Madison, Fox Valley cities, and select Milwaukee suburbs may offer opportunities for single family rentals aimed at professionals and families, while smaller cities and rural areas may support more yield driven strategies with lower entry prices and stable, if slower growing, rents.
Because public data do not separate single family metrics from attached and multifamily for sale product, investors must analyze local multiple listing service data and comparable sales for similar properties to refine pricing and rent assumptions. They should also consider local property tax regimes and insurance costs, both of which can vary significantly between jurisdictions and affect net yields.
Section 10Commercial Real Estate and Retail Centers
This review does not have access to public numeric series for office, industrial, or retail vacancy rates, asking rents, or cap rates in Wisconsin. Those metrics are typically compiled by commercial brokerage firms and specialized data providers. Federal or state statistical agencies do not publish comprehensive, high frequency commercial real estate operating statistics in a format that is accessible here.
Nonetheless, Wisconsin's sectoral employment structure and housing data provide insight into demand drivers for commercial real estate and retail centers. Manufacturing and trade, transportation, and utilities are historically important sectors for Wisconsin, supporting a base of industrial and logistics properties in and around metropolitan areas and along transport corridors. Bureau of Labor Statistics data show that statewide manufacturing employment was 456.7 thousand jobs in June 2026, down 0.4 percent over the year, while trade, transportation, and utilities employed 536.8 thousand people, down 2.1 percent year over year. The presence of large manufacturers and distribution centers in areas such as Milwaukee, Green Bay, and central Wisconsin suggests ongoing demand for warehouse and light industrial space even as these sectors have softened slightly.
In the Madison metropolitan area, total nonfarm employment of around 430 thousand jobs in mid 2026 includes significant professional and business services, education, and health services employment, which drive demand for office and medical office space as well as service oriented retail. Retail centers in Wisconsin range from small town main streets and neighborhood centers anchored by grocery stores to larger power centers and regional malls in suburban and metropolitan locations. Redfin's finding that more than a third of homes sold above list price statewide in May 2026 indicates that household formation and mobility remain active, which supports demand for grocery anchored and neighborhood retail centers that provide daily necessities and services.
Without numeric vacancy and rent data, investors must evaluate commercial and retail assets through property specific and submarket level information, including current and historical occupancy, tenant credit quality, lease terms, sales performance where available, and competition from nearby centers. For office assets, trends in remote work and employer space planning are critical. In markets like Madison, where knowledge and government employment are significant, well located and amenitized office buildings may remain competitive, while older or less flexible buildings may face long term challenges.
Industrial and logistics properties in Wisconsin can benefit from the state's central location in the upper Midwest and its transportation infrastructure, including interstate highways and rail connections. The continued growth in statewide construction employment suggests that new supply is entering the pipeline but not at an obviously excessive pace. However, the balance between new industrial construction and tenant demand must be assessed locally, especially near major corridors and distribution hubs.
Section 11Transactions and Capital Markets
There is no public statewide dataset in this environment that reports current transaction volumes or cap rates for commercial or residential income producing properties in Wisconsin. Data on closed sales, dollar volumes, and capitalization rates are typically collected from deeds, financing records, and brokerage activity by proprietary data firms and major brokerage houses, and these data are not available here.
On the for sale housing side, Redfin's statewide figures provide an indirect sense of transaction activity. The presence of 22,647 homes for sale in May 2026, up 5.8 percent from a year earlier, and a 5.7 percent increase in median sale price suggest that volume and pricing are moving upward together. The share of homes selling above list price at 36.9 percent indicates active bidding and suggests that buyers are willing to pay premiums for desirable properties.
Capital markets conditions for income producing real estate in Wisconsin generally follow national patterns. Interest rates have risen relative to earlier years, increasing borrowing costs and reducing proceeds for refinances and acquisitions. Lender appetite in a state like Wisconsin tends to be strongest for stabilized multifamily and industrial assets with solid sponsorship and tenancy, while office and certain types of retail assets may face tighter underwriting standards and higher required debt service coverage.
Because there are no public cap rate series here, investors must derive pricing expectations from transaction level evidence, lending quotes, and discussions with local brokers. In general, Wisconsin assets will not command the extremely low cap rates of the most supply constrained coastal gateway markets, but in high quality suburban and urban submarkets with strong tenant bases, cap rates can still reflect a premium for perceived stability and growth, especially in Madison and select Milwaukee suburbs.
Section 12Taxes
Property and income taxes play a significant role in the net returns of Wisconsin real estate investments. The Wisconsin Department of Revenue administers state tax laws and supports local revenue collection. Its homepage emphasizes the role of tax preparers and notes that millions of taxpayers filed their 2025 income taxes with the help of preparers and partners, but the extract available here does not provide numeric income tax rates, property tax mill rates, or sales tax percentages.
Because this environment does not surface specific statutory rates or average effective tax burdens, this review does not state Wisconsin's individual or corporate income tax rates, does not quantify the statewide sales tax rate, and does not provide effective property tax rates for residential or commercial properties, and no official public numeric rate is available on those points in this environment. It also does not detail any specific real estate transfer taxes or recording fees.
For underwriting, investors must obtain detailed tax information from official Wisconsin Department of Revenue publications, county treasurer and assessor offices, and professional tax advisors. Property tax assumptions should be based on actual historical tax bills for subject and comparable properties and should account for timing and magnitude of reassessments following acquisitions or substantial improvements. Income and sales tax considerations are also important for entity structuring and for assessing the after tax appeal of different investment strategies relative to other states.
Section 13Insurance
Insurance is both a cost factor and a risk management tool for Wisconsin property owners. The Wisconsin Office of the Commissioner of Insurance describes itself as the state's insurance watchdog and notes that in 2024 it recovered just over 7.5 million dollars for Wisconsin residents, ensuring that policyholders received coverage they had paid for. The office also highlights that Wisconsin's Healthcare Stability Plan has held health insurance rates down while supporting more choice for consumers.
The office homepage provides consumer tools, including lookup functions for agents, agencies, and companies, and access to information on health insurance, registered agents, and rate information. However, it does not provide statewide average property insurance premiums, loss ratios, or claim frequencies in numeric form in the extract available here. As a result, this review does not state typical insurance costs for residential or commercial properties in Wisconsin and does not compare premiums with other states, and no official public numeric premium figure is available on those points in this environment.
Wisconsin's physical risk profile includes exposure to flooding, severe storms, heavy snowfall, and, in some regions, tornadoes and hail. These hazards influence insurance costs and coverage terms. Investors should obtain property specific quotes for hazard, wind, and flood coverage where relevant and should assess how premiums and deductibles might evolve over the holding period, especially in areas with higher loss experience or evolving risk maps.
The office's consumer orientation and regulatory oversight can be a positive factor for property owners, as it provides a framework for fair claims handling and market stability. However, individual assets will experience different insurance cost trajectories depending on their location, construction type, and claims history.
Section 14Landlord Tenant and Regulatory Environment
The Wisconsin Department of Agriculture, Trade and Consumer Protection serves as the state's primary consumer protection agency and explicitly notes that Wisconsin law provides a legal framework for the relationship between landlords and tenants. Its landlord tenant materials emphasize that many disputes can be avoided if both parties understand their legal rights and responsibilities and that the Bureau of Consumer Protection provides resources to educate the public on these issues.
The department offers a Landlord Tenant Guide and a Tenants' Rights and Responsibilities fact sheet that discuss considerations before renting, during a tenancy, and when terminating a tenancy, as well as issues such as evictions and unhealthy or unsafe conditions. While the documents themselves are not readable here, the public description makes clear that Wisconsin uses a structured statutory approach to landlord tenant relationships, with defined rights and obligations on both sides.
There is no indication in the available state consumer protection materials of a statewide rent control regime that caps rent levels or rent increases for privately owned residential properties. Instead, rents are generally set by contract between landlords and tenants, subject to compliance with fair housing laws and consumer protection regulations. Eviction processes, security deposits, habitability standards, and notice requirements are governed by state statutes and administrative rules.
For investors, this regulatory environment means that residential income properties in Wisconsin are typically operated under market based rent setting, with legal protections that must be observed but without the complex rent stabilization frameworks found in some coastal jurisdictions. Nonetheless, eviction procedures, notice timelines, and specific lease content requirements can materially affect operations and should be understood through local counsel and detailed review of the relevant statutes and department guidance.
Section 15Infrastructure
Wisconsin's infrastructure network underpins its real estate markets. Major interstate highways, including corridors such as I 90 and I 94, connect Wisconsin cities to Chicago, Minneapolis, and other regional centers, supporting both commuter flows and freight transportation. State and local road networks link smaller cities and rural areas to metropolitan hubs, enabling commuting and distribution.
Rail infrastructure supports both freight and passenger movement, with freight rail lines serving agricultural, manufacturing, and port facilities and passenger services connecting key cities. Airports in Milwaukee, Madison, Green Bay, and other communities provide regional and national air connections, which are important for business travel and tourism.
Wisconsin's location on the Great Lakes and along the Mississippi River adds a waterborne transportation dimension, with ports handling a mix of bulk and containerized cargo. This enhances the strategic value of industrial and logistics properties near these hubs and along associated transport corridors.
Utilities and digital infrastructure, including electricity, natural gas, water, wastewater, and broadband, are critical for supporting residential and commercial growth. While this review does not quote system capacities or investment plans in numeric form, investors should account for the reliability and cost of utilities and the availability of high speed internet when evaluating properties, particularly those aimed at technology, logistics, and remote work oriented tenants.
Section 16Climate and Physical Risks
Climate and physical risks in Wisconsin include flooding, severe storms, heavy snowfall, river and lake level fluctuations, and localized tornado and hail activity. The Federal Emergency Management Agency explains that floods occur naturally and can happen almost anywhere, not only near rivers and coasts. FEMA notes that flood maps show how likely it is for an area to flood and that any place with at least a one percent annual chance of flooding is considered high risk, with at least a one in four chance of flooding during a thirty year mortgage period.
FEMA emphasizes that floods do not follow city limits or property lines and that even areas outside designated high risk zones can experience flooding due to heavy rain, poor drainage, or nearby construction. This guidance applies directly to Wisconsin communities along rivers, low lying urban areas, and regions near lakes and wetlands. For real estate investors, this means that property level flood risk assessment, including review of FEMA flood maps and local drainage patterns, is essential.
The National Centers for Environmental Information maintains one of the largest environmental data archives in the world, including climate and weather observations. Long term climate records for the Great Lakes and upper Midwest show trends in temperature, precipitation patterns, and extreme weather events that can influence building performance, maintenance costs, and insurance.
In Wisconsin, heavy snowfall and freeze thaw cycles can affect building envelopes, roofs, and pavements, while severe thunderstorms can bring high winds and hail that damage structures and power infrastructure. River and lake flooding can threaten properties near waterways, and localized tornado activity can cause concentrated damage. Over time, changes in precipitation and temperature patterns may shift the risk profiles of specific locations.
Investors should incorporate climate and physical risk into due diligence by reviewing FEMA flood maps, understanding local climate histories, and evaluating building design and systems for resilience. Insurance coverage for flood and other hazards should be examined carefully, including any exclusions or high deductibles that could affect cash flows after an event.
Section 17Opportunities
Wisconsin offers several opportunity themes for accredited real estate investors.
One opportunity lies in housing markets where price growth is strong but absolute price levels remain moderate relative to national and coastal benchmarks. Redfin's finding that Wisconsin's median sale price of 351,252 dollars in May 2026 is below the national median but has grown 5.7 percent year over year suggests potential for both investor entry at reasonable price points and possible future appreciation, though such appreciation is not assured. The double digit price growth in cities like Caledonia, Mequon, Wausau, and Port Washington shows that select submarkets are experiencing particularly strong demand.
Another opportunity is in multifamily and affordable housing. The Wisconsin Housing and Economic Development Authority's financing of more than 88,700 affordable rental units since 1972 demonstrates both the scale of affordable housing need and the state's willingness to support such projects. Investors who can partner with the authority and similar programs to deliver high quality, income restricted or workforce housing may find stable demand and favorable financing structures, particularly in growing metros and regional centers.
Industrial and logistics real estate tied to Wisconsin's manufacturing, agriculture, and distribution base also offers potential. The positive twelve month growth in statewide construction employment and the state's central location in the upper Midwest support the case for well located warehouses and light industrial facilities, especially along major transportation corridors and near ports and intermodal hubs.
Office and medical office assets in Madison and select Milwaukee suburbs represent another area of opportunity. Madison's total nonfarm employment of around 430 thousand jobs and low unemployment of 3.0 percent in June 2026 reflect a stable and educated workforce, anchored by government and university employment. High quality office and medical office properties in such markets, particularly those near campuses and hospital systems, can provide resilient cash flows over a long horizon.
Section 18Risks
Wisconsin real estate also carries a range of risks that must be considered.
One risk stems from valuation and price dynamics. While Wisconsin's median sale price remains below the national median, the 5.7 percent year over year growth and double digit gains in some cities raise the possibility that certain submarkets may be stretching affordability, especially if income growth lags behind housing costs. A slowdown in national or regional economic conditions could temper demand and put pressure on prices and rents in those higher growth pockets.
Another risk involves data limitations. This review has highlighted that public, nonproprietary data for rents, vacancy rates, and commercial real estate operating metrics are not accessible here. Without reliable statewide or metro level series for these variables, investors who rely solely on public data face blind spots that can lead to misjudgments about market tightness, achievable rents, and competitive supply.
Sector specific risks are also important. Office properties face ongoing uncertainty due to remote and hybrid work patterns, particularly in older buildings or in locations that lack strong amenities or connectivity. Retail properties that depend heavily on discretionary spending or outdated formats may struggle as consumer preferences continue to evolve, even as grocery anchored and neighborhood centers remain comparatively resilient. Industrial and logistics assets tied to specific industries or tenants may be vulnerable if those sectors face cyclical or structural headwinds.
Climate and physical risks, including flooding, severe storms, heavy snow, and freeze thaw related wear, can increase operating and capital expenditure requirements over time. Properties not designed or maintained to handle these stresses may experience higher repair costs, reduced tenant satisfaction, or insurance challenges.
Finally, capital markets risks are material. Higher interest rates increase debt service costs and may reduce available leverage or proceeds on refinancing. In secondary markets such as many Wisconsin cities, liquidity for large or specialized assets can diminish during market stress, potentially affecting exit strategies and valuations.
Section 19Investor Implications
For accredited investors, the Wisconsin real estate market offers a blend of stable income and growth oriented opportunities, but it demands careful, data informed underwriting. The labor market data from the Bureau of Labor Statistics show a state with low unemployment and essentially flat yet stable employment, with moderate growth in construction and a diversified sector base. Housing data from Redfin indicate that Wisconsin's home prices are rising faster than the national average from a lower base, with a relatively high share of homes selling above list price.
These conditions support strategies focused on workforce and middle market multifamily, single family rentals in growing submarkets, and industrial and logistics assets linked to manufacturing and distribution. At the same time, the absence of public rental and vacancy data and the lack of statewide commercial operating metrics require investors to invest in local knowledge, proprietary data subscriptions, and thorough property level due diligence.
Portfolio construction that uses Wisconsin assets as a source of steady income and measured growth alongside holdings in other regions can benefit from the state's relative affordability and sector diversity. However, allocations should be calibrated to reflect specific regional strengths and weaknesses within Wisconsin, recognizing that Madison, Milwaukee suburbs, and certain regional centers have different risk and return profiles than smaller towns and rural areas, and that outcomes are not assured.
Section 20Conclusion
Wisconsin's statewide real estate and multifamily markets are anchored by a stable labor market, a for sale housing sector with above national price growth from a moderate price base, and a network of institutions and agencies that support affordable housing and consumer protection. Public data from the Bureau of Labor Statistics and Redfin provide a solid, if incomplete, foundation for understanding these dynamics, while agencies like the Wisconsin Housing and Economic Development Authority, the Department of Agriculture, Trade and Consumer Protection, the Office of the Commissioner of Insurance, FEMA, and NOAA offer context on housing policy, regulation, and risk.
Significant data gaps remain for population, income, rents, vacancy rates, and cap rates at the state and metro levels in this environment. Those gaps mean that investors cannot rely solely on public data to make capital allocation decisions in Wisconsin. Instead, they must integrate the available statewide and metro indicators with proprietary research, local market intelligence, and property specific analysis.
For investors prepared to do that work, Wisconsin may present opportunities in multifamily, single family rentals, industrial and logistics, and select commercial properties, though no particular outcome is assured. The key is to match investment strategies to the underlying economic and demographic realities of each market within the state, to account for regulatory and physical risks, and to approach underwriting with both discipline and a nuanced understanding of Wisconsin's position within the broader United States real estate landscape.
Sources
- United States Bureau of Labor Statistics, Wisconsin Economy at a Glance. Statewide civilian labor force, employment, unemployment, unemployment rate, total nonfarm employment, and sector employment including mining and logging, construction, manufacturing, and trade, transportation, and utilities, with twelve month percent changes for January through June 2026, seasonally adjusted; data extracted August 7, 2026.
- United States Bureau of Labor Statistics, Madison, Wisconsin Economy at a Glance. Metropolitan civilian labor force, employment, unemployment, unemployment rate, total nonfarm employment, mining, logging and construction employment, manufacturing employment, and twelve month percent changes for January through June 2026, not seasonally adjusted; data extracted August 7, 2026.
- Redfin, Wisconsin housing market. Statewide median sale price across all home types of 351,252 dollars with 5.7 percent year over year increase in May 2026, 22,647 homes for sale with 5.8 percent year over year increase in May 2026, 36.9 percent of homes sold above list price with a 0.65 percentage point year over year decline in May 2026, and list of top ten Wisconsin metros by sales price growth including Caledonia at 38.9 percent and Mequon at 30.3 percent; data extracted August 7, 2026.
- Redfin, United States housing market overview. National median sale price across all home types of 398,771 dollars with 2.0 percent year over year increase in May 2026, 1,483,839 homes for sale with 0.7 percent year over year increase in May 2026, 24.9 percent of homes sold above list price with a 0.083 percentage point year over year decline in May 2026, and national migration statistics for January through March 2026; data extracted August 7, 2026.
- Wisconsin Department of Administration, Demographic Services Center, Population and Housing Unit Estimates. Description of annual population estimates for Wisconsin counties and municipalities, including January 1, 2025 final population estimates and components of change available via Excel workbooks; text extract referenced for methodology and presence of state generated estimates, accessed August 7, 2026.
- Wisconsin Housing and Economic Development Authority, homepage. Description of the authority's mission and activities, including the statement that since 1972 it has financed more than 88,700 affordable rental units, helped more than 141,800 families purchase a home, and made more than 29,280 small business and agricultural loan guarantees; accessed August 7, 2026.
- Wisconsin Department of Agriculture, Trade and Consumer Protection, Landlord Tenant Guide page. Description of the department as Wisconsin's primary consumer protection agency, explanation that Wisconsin law provides a legal framework for the relationship between landlords and tenants, and description of the Landlord Tenant Guide and Tenants' Rights and Responsibilities fact sheet; accessed August 7, 2026.
- Wisconsin Office of the Commissioner of Insurance, homepage. Description of consumer tools and regulatory role, including the statement that the office recovered just over 7.5 million dollars for Wisconsin residents in 2024 and that the Healthcare Stability Plan has held health insurance rates down while supporting more choice; accessed August 7, 2026.
- Wisconsin Department of Revenue, homepage. Description of the department's role and acknowledgement of tax preparers and partners supporting millions of taxpayers with their 2025 income tax filings; referenced to note the administrative context for Wisconsin taxes, accessed August 7, 2026.
- Federal Emergency Management Agency, Flood Maps. Explanation that floods can occur almost anywhere, that flood maps show areas with at least a one percent annual chance of flooding which have at least a one in four chance of flooding during a thirty year mortgage, and discussion of how flood maps are used to understand and manage flood risk; accessed August 7, 2026.
- National Centers for Environmental Information, main page. Description of the agency as one of the largest environmental data archives in the world and overview of climate, oceanographic, and geophysical data access; accessed August 7, 2026.
- United States Department of Housing and Urban Development, FY 2024 Fair Market Rents Documentation System. Geography selection interface that prompts users to select a state, county, or metropolitan Fair Market Rent area without displaying numeric rent values in the readable text; referenced to explain absence of public rent figures, accessed August 7, 2026.
- United States Census Bureau, QuickFacts Wisconsin. Attempts to access the page returned a Cloudflare security message indicating that access has been blocked, preventing retrieval of population, income, and housing statistics; referenced to document data access constraints, accessed August 7, 2026.