In brief · summary: Wyoming
Wyoming State Real Estate Market Review
Section 01Executive Summary
Wyoming is a small, energy oriented state with a labor market and housing stock that are large enough to matter for regional portfolios but still thin enough that public data are limited. The most reliable quantitative information for investors today comes from the Bureau of Labor Statistics for employment and from Redfin for statewide housing prices, supply, and demand indicators. United States Census Bureau QuickFacts pages for Wyoming are blocked by a Cloudflare security screen in this environment, and interactive Census and Bureau of Economic Analysis tools do not yield readable numeric values, so this review does not present current official population or income figures.
Per the Bureau of Labor Statistics, Wyoming's statewide civilian labor force was 287.0 thousand people in May 2026 and a preliminary 286.0 thousand in June 2026, seasonally adjusted. Employment was 277.3 thousand in May and a preliminary 276.9 thousand in June, yielding unemployment of 9.6 thousand and 9.0 thousand respectively and unemployment rates of 3.4 percent and a preliminary 3.2 percent. Total nonfarm employment was 296.5 thousand jobs in May and a preliminary 296.9 thousand in June, with a twelve month percent change in total nonfarm employment of 0.6 percent in May and 1.0 percent in June. Mining and logging employment was 15.4 thousand jobs in both May and June, while construction employment was 24.1 thousand in May and 24.2 thousand in June, with construction showing positive year over year growth as of late spring 2026. These numbers describe a small but reasonably tight labor market with modest job growth and significant exposure to resource extraction and construction.
On the housing side, Redfin reports that the median sale price across all home types in Wyoming was 378,655 dollars in May 2026, up 1.0 percent compared with May 2025. There were 3,024 homes for sale statewide in May 2026, down 1.2 percent year over year, and 5.3 percent of homes sold above list price, down 1.0 percentage point from the prior year. Nationally, Redfin shows a median sale price of 398,771 dollars in May 2026, up 2.0 percent year over year, with 1,483,839 homes for sale, up 0.7 percent, and 24.9 percent of homes selling above list, down 0.083 percentage points. Taken together, these data indicate that Wyoming's for sale housing is slightly more affordable than the national average, with slower recent price growth, tighter inventory, and relatively subdued bidding competition.
On the policy side, the Wyoming Community Development Authority notes that since 1975 it has acted as the state's leading resource for housing finance, providing low interest single family mortgages, down payment assistance, and home buyer education, and administering federal rental housing development programs. The authority states that the Low Income Housing Tax Credit, National Housing Trust Fund, and HOME programs it administers have funded more than 5,000 units of affordable rental housing across Wyoming. This institutional infrastructure matters for multifamily investors, especially in the affordable and workforce segments.
Because public numeric data on rents, vacancy, capitalization rates, and transaction volumes are not available statewide in the permitted public sources for this review, those aspects are discussed qualitatively, and investors are directed toward property level underwriting and proprietary data for precise figures. Within those constraints, Wyoming offers exposure to energy and resource driven employment, tourism, and small city economies, with housing prices that are below national medians and jobless rates that currently sit in the low single digits.
Section 02Population and Migration
This review cannot provide a current official population figure for Wyoming or for its counties and cities, nor can it quote demographic breakdowns by age, race, or household type. Attempts to access the United States Census Bureau QuickFacts table that would normally summarize population and demographic data for Wyoming result in a Cloudflare security page that states access to the Census site is blocked. The message explains that the website is using a security service to protect itself from online attacks and that the requested content cannot be displayed. In this environment, that block prevents retrieval of any numeric population, age distribution, or household data for the state.
Similarly, interactive Census tools that provide annual population estimates by state and county, and American Community Survey tables that describe detailed demographic and migration patterns, are not accessible in a way that exposes their numeric content. Because of this, this review does not state the number of people living in Wyoming, does not present population growth or decline over time, and does not provide urban rural shares or demographic composition of major cities such as Cheyenne, Casper, or Gillette, and no official public numeric population figure is available on those points in this environment. Any investment decision requiring precise counts must rely on up to date Census tabulations obtained outside this environment or on proprietary demographic datasets.
Migration patterns are partially visible through national housing search data. Redfin reports that between January and March 2026, 19 percent of homebuyers using its platform searched for homes in a different metropolitan area than their current one. The top five destination states in that period were Florida, Arizona, South Carolina, Tennessee, and Nevada, while the top five origin states were California, New York, Illinois, Washington, and Massachusetts. Wyoming does not appear in these national top five lists for either inbound or outbound search activity, nor does it feature among the top ten inbound or outbound metropolitan areas in the Redfin migration table. That absence suggests that, in this particular dataset, Wyoming is not currently among the largest net recipients or sources of interstate homebuyer migration, at least in early 2026.
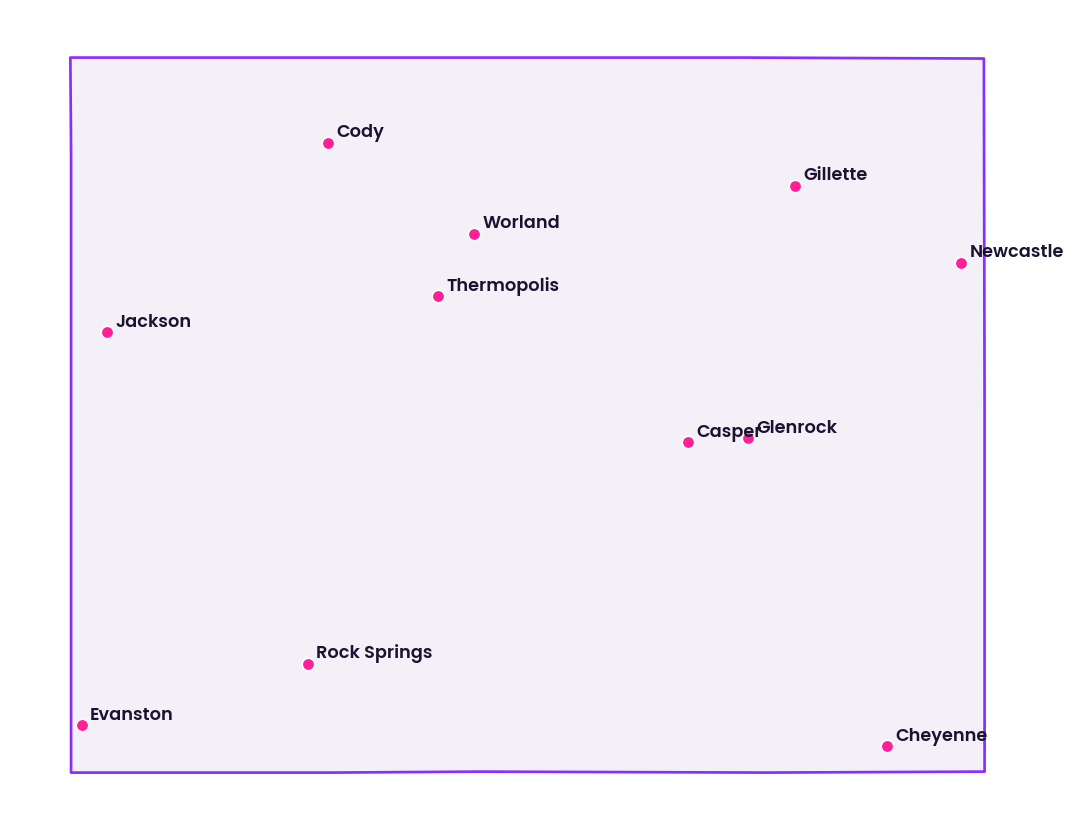
Within Wyoming, Redfin identifies a set of cities that are among the most competitive local housing markets based on its Compete Score metric. The top ten most competitive cities listed for Wyoming are Bar Nunn, Evansville, Casper, Glenrock, Newcastle, Rock Springs, Thermopolis, Gillette, Evanston, and Worland. While no numeric migration figures are associated with these cities in the accessible extract, their appearance as competitive housing markets implies localized demand pressure and, likely, some degree of population or household movement within the state toward those communities.
For investors, the practical implication is that public migration and demographic data at the state and sub state levels are not available in this environment, so decisions must be grounded in alternative sources such as proprietary demographic profiles, school enrollment trends, utility connection data, and local knowledge. The Redfin migration data show that Wyoming is not a headline national migration magnet in 2026, but the presence of competitive submarkets within the state indicates that intra state and regional dynamics can still be important drivers of housing demand.
Section 03Jobs and Economic Anchors
The Bureau of Labor Statistics Economy at a Glance table for Wyoming provides the clearest quantitative snapshot of the state's labor market in 2026. The table reports statewide, seasonally adjusted monthly figures for the civilian labor force, employment, unemployment, unemployment rate, and total nonfarm wage and salary employment, along with sector employment for mining and logging and for construction, and associated twelve month percent changes.
The following table summarizes Wyoming's key labor market indicators for the first half of 2026.
| Month 2026 (statewide, seasonally adjusted) | Civilian labor force, thousands | Employment, thousands | Unemployment, thousands | Unemployment rate, percent | Total nonfarm employment, thousands | Twelve month percent change in total nonfarm employment |
|---|---|---|---|---|---|---|
| January | 288.5 | 278.2 | 10.2 | 3.6% | 293.2 | -0.4% |
| February | 288.5 | 278.1 | 10.4 | 3.6% | 294.3 | -0.2% |
| March | 288.0 | 277.7 | 10.3 | 3.6% | 294.4 | 0.0% |
| April | 287.6 | 277.6 | 10.1 | 3.5% | 294.6 | -0.1% |
| May | 287.0 | 277.3 | 9.6 | 3.4% | 296.5 | 0.6% |
| June (preliminary) | 286.0 | 276.9 | 9.0 | 3.2% | 296.9 | 1.0% |
Over this six month period, Wyoming's civilian labor force edged down from 288.5 thousand in January to a preliminary 286.0 thousand in June, while employment declined slightly from 278.2 thousand to a preliminary 276.9 thousand. Despite this small contraction, unemployment fell from 10.2 thousand people in January to 9.0 thousand in June, and the unemployment rate improved from 3.6 percent to a preliminary 3.2 percent. Total nonfarm employment grew from 293.2 thousand jobs in January to a preliminary 296.9 thousand in June, and the twelve month percent change in total nonfarm employment shifted from negative 0.4 percent in January to positive 1.0 percent in June. For investors, these numbers indicate a small state economy that has moved from slight year over year job losses into modest positive job growth by mid 2026, with unemployment in the low single digits throughout.
Sector data for mining and logging and for construction illustrate the role of resource extraction and building in Wyoming's economy. Mining and logging employment was 14.9 thousand jobs in January 2026, rose to 15.3 thousand in February, and then held around 15.1 to 15.4 thousand from March through June, with 15.4 thousand jobs reported in both May and preliminary June. The twelve month percent change in mining and logging employment remained negative throughout this period, ranging from negative 5.7 percent in January to negative 1.9 percent in preliminary June. Construction employment was 23.7 thousand jobs in January, 23.9 thousand in February, and 24.0 thousand in March and April, before reaching 24.1 thousand in May and a preliminary 24.2 thousand in June. The twelve month percent change in construction employment improved from negative 0.4 percent in January to positive 3.4 percent in preliminary June.
These sector trends are consistent with an economy where energy and resource extraction remain important but have been under some pressure compared with a year earlier, while construction activity has gradually strengthened. Other sectors such as trade, transportation and utilities, professional and business services, education and health services, leisure and hospitality, and government also contribute to statewide employment, with education and health services and leisure and hospitality both posting year over year gains by mid 2026.
Major employers in Wyoming typically include energy and mining companies, utilities, state and local government, healthcare systems, education institutions, and tourism related businesses serving national parks and recreation areas. While this review does not have a public dataset listing employers by name or size, the sector employment data and the state's well known resource and tourism profile indicate that energy price cycles, regulatory frameworks for extraction, and visitor volumes to parks and recreation sites are key anchors for demand in both residential and commercial real estate.
For investors, the key takeaway from the labor data is that Wyoming's statewide employment base is small in absolute terms, at under 300 thousand nonfarm jobs, but unemployment is low and total employment is again growing modestly. That means real estate demand is sensitive to sector specific shifts, particularly in mining and logging, but is supported by overall labor market stability as of mid 2026.
Section 04Income
In this environment, there is no accessible public series that provides current numeric income figures for Wyoming, such as statewide median household income, per capita income, or income distribution by quintile. The Census Bureau QuickFacts page that would normally offer median household income and per capita income is blocked by Cloudflare, and American Community Survey detailed tables containing income measures are not readable here. The Bureau of Economic Analysis publishes annual and quarterly state personal income data, but those series are delivered through interactive tools that do not expose specific numeric values in the text output available to this review.
Because of these limitations, this review does not state any income levels for Wyoming residents, does not compare Wyoming incomes with United States medians, and does not quantify wage or income growth over time, and no official public numeric income figure is available on those points in this environment. It also does not provide income differences by sector, occupation, or region within the state.
Qualitatively, income conditions in Wyoming are shaped by earnings in mining and energy extraction, construction, trade and transportation, tourism and hospitality, health care and education, and public sector employment. The statewide unemployment rate, which ranged between 3.2 and 3.6 percent in the first half of 2026, indicates that a high share of the labor force is employed, but it does not reveal pay levels or inequality.
For investment analysis, the absence of public income statistics means that underwriting assumptions about rent affordability, retail spending power, and office tenant credit must rely on property level data, lender and agency underwriting standards, and proprietary demographic profiles. When positioning multifamily or single family rental product in Wyoming, investors should draw on local leasing experience and competitive surveys to ensure that proposed rents align with observed household incomes, given the lack of statewide income benchmarks here.
Section 05Housing and Multifamily
Redfin's statewide housing data provide the main quantitative view of Wyoming's for sale housing market as of mid 2026. According to Redfin, the median sale price across all home types in Wyoming was 378,655 dollars in May 2026, an increase of 1.0 percent compared with May 2025. In the same month, there were 3,024 homes for sale statewide, which represents a 1.2 percent decrease in the number of homes for sale compared with a year earlier. The share of homes that sold above list price was 5.3 percent in May 2026, down by 1.0 percentage point from the prior year.
For context, Redfin reports that the national median sale price across all home types was 398,771 dollars in May 2026, up 2.0 percent year over year, with 1,483,839 homes for sale, up 0.7 percent year over year. Nationwide, 24.9 percent of homes sold above list price in May 2026, a decline of 0.083 percentage points from a year earlier.
The table below contrasts these key May 2026 metrics for Wyoming and the United States.
| Geography (all home types, May 2026) | Median sale price, dollars | Year over year change in median sale price, percent | Number of homes for sale | Year over year change in homes for sale, percent | Share of homes sold above list price, percent | Change in share sold above list price, percentage points |
|---|---|---|---|---|---|---|
| Wyoming | 378,655 | 1.0% | 3,024 | -1.2% | 5.3% | -1.0% |
| United States | 398,771 | 2.0% | 1,483,839 | 0.7% | 24.9% | -0.083% |
These figures indicate that Wyoming's median sale price is slightly below the national median but relatively close in absolute terms, and that price growth over the prior year has been slower in Wyoming than nationwide. The 1.2 percent decline in statewide inventory suggests a small tightening of supply, in contrast with the modest national increase in homes for sale. Most striking is the difference in bidding intensity: only 5.3 percent of homes in Wyoming sold above list price in May 2026, compared with 24.9 percent nationally. This low share of above list transactions underscores that many Wyoming submarkets are relatively less competitive than major national markets, which can be advantageous for yield oriented investors who prefer to avoid severe bidding wars.
These Redfin metrics cover all home types and therefore combine single family detached homes, townhouses, condominiums, and small multifamily properties, with single family assets typically dominating the count. Public data do not separate multifamily asset prices from the overall median, nor do they provide per unit pricing for larger apartment projects. As a result, this review cannot quote state level median sale prices specifically for multifamily properties or small apartment buildings.
The Wyoming Community Development Authority provides important context for multifamily housing conditions through its role in financing affordable rental units. The authority states that it administers the Low Income Housing Tax Credit, National Housing Trust Fund, and HOME Investment Partnerships programs and that these federal programs have funded more than 5,000 units of affordable rental housing across the state. It also maintains a rental directory listing affordable developments by location. Although this review does not have a breakdown of those units by county or year of delivery, the existence of more than 5,000 subsidized units reflects a meaningful affordable and workforce multifamily footprint relative to the state's small population.
From an investor's perspective, statewide housing and multifamily conditions in Wyoming can be summarized as follows. Prices are relatively high in absolute terms compared with many Midwestern and Southern states but below national medians, price growth is modest, supply has tightened somewhat, and bidding competition is limited. Affordable rental stock has been built through federal programs but is not quantified by market wide rent or vacancy metrics. That combination suggests opportunities in both market rate and affordable multifamily segments, particularly in submarkets where employment is anchored by energy, logistics, government, or tourism and where new supply is constrained.
Section 06Rents
There is no public numeric dataset accessible in this environment that provides current rent levels for Wyoming as a whole or for its cities and counties. The United States Department of Housing and Urban Development's fiscal year 2024 Fair Market Rent documentation system presents an online interface that prompts users to select a state, a county, or a metropolitan Fair Market Rent area, but in this environment the interface does not display any actual rent values in dollars in the readable text. It only shows options to select geographies, so this review cannot extract Wyoming's Fair Market Rent levels for any bedroom size.
American Community Survey tables that would normally contain statewide and local median gross rent figures are not accessible here in a usable format, and proprietary rent indices from private providers are not available as public sources for this analysis. As a result, this review does not state a median rent figure for Wyoming, does not provide rent levels by unit type, and does not present rent growth rates over time at the state or metro level, and no official public numeric rent figure is available on those points in this environment.
In the absence of public rent statistics, investor understanding of rents in Wyoming must be grounded in property level data and competitive market surveys. Rent rolls, lease up histories, asking rent surveys, and appraisals for existing properties are essential inputs. Statewide home price and supply metrics from Redfin provide some indirect clues: with a median sale price of 378,655 dollars and a small decline in inventory, ownership housing is not deeply depressed or oversupplied, which suggests that rental demand likely remains healthy in many submarkets. The share of homes selling above list price, at 5.3 percent, points to moderate but not extreme buyer competition, which can affect the relative attractiveness of renting versus owning.
For multifamily investors, this environment calls for conservative rent assumptions and careful scenario testing, especially in smaller markets where a few new projects or employer changes can materially affect demand. Without statewide rent benchmarks, underwriting should be anchored in the specific micro markets and tenant segments a property serves, rather than in generalized state level rent trends.
Section 07Vacancy
Public data do not provide statewide apartment or commercial vacancy rates for Wyoming in this environment. The Census Bureau's housing surveys produce rental and homeowner vacancy rates, but the detailed tables that break these measures down by geography and time are not accessible here in a machine readable form. Similarly, there is no public series that tracks office, industrial, or retail vacancy rates in Wyoming; such information is usually compiled by proprietary commercial real estate data providers.
Because of this, this review does not state current or historical vacancy rates for multifamily properties, for single family rentals, or for office, industrial, or retail properties in Wyoming, and no official public numeric vacancy figure is available on those points in this environment. It also does not present absorption figures, which would require data on net changes in occupied space over time.
However, labor and housing indicators provide some indirect context. Wyoming's unemployment rate remained between 3.2 and 3.6 percent from January through June 2026, and total nonfarm employment improved from a negative twelve month change of 0.4 percent in January to a positive 1.0 percent in June. These figures suggest that most residents who want to work are employed, which generally supports occupancy in both residential and commercial properties. In the housing market, the 1.2 percent year over year decline in the number of homes for sale in May 2026 and the modest 1.0 percent increase in median sale price point to stable demand and limited oversupply in ownership housing.
Given the lack of direct vacancy statistics, investors in Wyoming must rely on property level occupancy histories, lender and appraisal reports, and local brokerage insights to understand leasing risk. This is especially important in small and thinly traded submarkets, where shifts in one or two anchor tenants can affect vacancy more significantly than in large metropolitan areas.
Section 08Supply Pipeline
A robust assessment of real estate supply pipelines typically requires building permit data, construction starts, and counts of units or square footage under construction. In public data, these come from Census Bureau building permit surveys, local planning and permitting departments, and sometimes state construction reports. In this environment, those data are not accessible for Wyoming in a form that yields numeric counts, so this review cannot state how many multifamily units, single family homes, or square feet of commercial space are currently under construction or planned statewide or in specific metros.
The Bureau of Labor Statistics sector employment data do offer some insight into construction activity. The statewide construction employment count was 23.7 thousand jobs in January 2026 and rose gradually to a preliminary 24.2 thousand jobs in June 2026. The twelve month percent change in construction employment improved from negative 0.4 percent in January to positive 3.4 percent in preliminary June. This pattern suggests that construction activity in Wyoming has picked up over the past year, but not explosively, which points to a steady rather than a speculative building environment.
On the policy side, the Wyoming Community Development Authority highlights a completed Statewide Strategic Housing Action Plan and a story mapping tool that localities can use for housing planning. The authority notes that its federal affordable rental programs have funded more than 5,000 units of affordable housing across the state over time. While the plan and mapping tool are accessible through links, the numeric details of projected housing needs and recommended supply pipelines are contained in a document that is not machine readable in this environment, so this review cannot quote specific planned unit counts or deficits.
From an investment perspective, the absence of detailed public supply metrics means that evaluating competition and future supply in Wyoming depends heavily on local permitting records, on the ground intelligence, and proprietary development databases. The available public signals, namely a modest increase in construction employment and a history of more than 5,000 affordable units developed under programs administered by the authority, suggest that supply is being added but not at a pace that obviously overwhelms demand statewide.
Section 09Single Family Homes
Single family homes dominate the owner occupied and a significant portion of the rental housing stock in Wyoming. Redfin's statewide housing metrics, which include all home types, are therefore strongly influenced by single family detached homes.
As noted earlier, Redfin reports that the median sale price across all home types in Wyoming was 378,655 dollars in May 2026, up 1.0 percent compared with May 2025. The 3,024 homes for sale statewide in May represent a 1.2 percent reduction from a year earlier, indicating that overall for sale inventory has tightened slightly. The share of homes sold above list price, at 5.3 percent, is low compared with the national figure of 24.9 percent, and it declined by 1.0 percentage point over the year. Together, these numbers suggest that Wyoming is not experiencing an extreme single family bidding frenzy; instead, it appears as a market where buyers face modest price appreciation and somewhat limited inventory but where transactions are generally closer to list prices.
From a single family rental perspective, this environment can be attractive. Purchase prices are meaningful in absolute terms but lower than the national median, and limited above list bidding pressure may allow disciplined buyers to acquire assets without paying a large premium. The relatively stable labor market, with unemployment in the low single digits, supports tenant demand, while the lack of steep year over year price increases may reduce the risk of near term price corrections from stretched valuations.
Redfin's list of the most competitive cities in Wyoming, which includes Bar Nunn, Evansville, Casper, Glenrock, Newcastle, Rock Springs, Thermopolis, Gillette, Evanston, and Worland, points to submarkets where demand conditions are tighter and where single family investors may find both opportunities and competition. In such locations, well located single family rentals can benefit from local demand for quality housing, while acquisition pricing may be more challenging.
Because this review does not have access to statewide days on market, price per square foot, or months of supply metrics in a form that can be cited, it cannot quantify single family liquidity or depth of buyer pools beyond the broad Redfin indicators. Investors should therefore combine these statewide signals with local broker expertise, multiple listing service data, and detailed comparable sales analysis when evaluating single family investments in Wyoming.
Section 10Commercial Real Estate and Retail Centers
There is no public dataset in this environment that provides statewide vacancy rates, asking rents, or capitalization rates for office, industrial, or retail properties in Wyoming. Commercial real estate performance metrics are generally compiled by proprietary data providers and brokerages and are not part of the public sources used here. As a result, this review cannot state average office or industrial vacancy rates in Cheyenne or Casper, typical retail rents in grocery anchored centers, or cap rates for warehouse, flex, or shopping center assets across the state.
Nonetheless, the structure of Wyoming's economy and its labor market provide clues about commercial real estate demand. Mining and logging employment of 15.4 thousand jobs and construction employment of 24.1 to 24.2 thousand jobs in May and preliminary June 2026 imply that a nontrivial share of statewide employment is tied to energy extraction, infrastructure, and development. These sectors typically support demand for industrial properties, including equipment storage yards, fabrication and maintenance shops, and logistics and distribution facilities that serve energy projects and regional supply chains.
Office demand in Wyoming is likely concentrated in state and local government, professional services tied to energy and land use, healthcare, and education. While this review does not have numeric data on office space inventories or absorption, the small absolute size of the labor market suggests that office markets are thin and heavily influenced by a limited number of anchor tenants in each city.
Retail centers, including grocery anchored and neighborhood shopping centers, serve both local residents and tourists. Given Wyoming's role as a gateway to national parks and outdoor recreation, retail and hospitality demand in cities like Jackson, Cody, and other tourism dependent communities is strongly seasonal and influenced by visitor volumes and travel patterns. In contrast, retail demand in cities like Cheyenne and Casper is more closely linked to resident spending, government employment, and regional services.
For investors, the absence of public commercial performance metrics means that underwriting in Wyoming must be highly property specific and grounded in tenant credit, lease terms, and micro location fundamentals. Assets with tenants tied to resilient sectors such as government, healthcare, and essential retail may offer more stable cash flows, while properties dependent on discretionary retail or cyclical energy support services carry higher volatility. Cap rate expectations must be derived from actual comparable transactions and lender feedback rather than from statewide averages.
Section 11Transactions and Capital Markets
Public sources used in this review do not provide aggregated transaction volumes or capitalization rate series for real estate in Wyoming. County recorder offices maintain public records of deeds and mortgages, but those records are not compiled into statewide statistics in the datasets accessible here. Similarly, there are no public time series for apartment, office, or industrial cap rates at the state level; those measures are typically reported in proprietary market reports.
The Redfin statewide housing data nonetheless provide some insight into the breadth of residential market activity. Having 3,024 homes for sale in May 2026, down 1.2 percent from a year earlier, coupled with a 1.0 percent increase in median sale price, indicates that transaction activity has occurred at price levels slightly above the prior year, with a modest contraction in inventory. The low share of above list sales, at 5.3 percent, suggests that buyers and sellers are often meeting near list prices rather than engaging in intense bidding wars.
Nationally, higher interest rates relative to the low rate era earlier in the decade have affected capital markets for income producing real estate, and lenders have become more cautious, often prioritizing larger, liquid markets and property types with strong cash flows. While this review does not have public data on loan volumes or spreads specific to Wyoming, it is reasonable to expect that smaller markets in the state may face tighter financing conditions and higher required yields than primary coastal metros.
For accredited investors, this means that Wyoming assets are likely transacting at cap rates that are higher than those in core gateway markets, reflecting both smaller market risk and sector specific exposure. However, the precise levels of those cap rates and the depth of the buyer pool depend on individual asset quality, tenant strength, and location, and cannot be specified here from public data alone.
Section 12Taxes
The Wyoming Department of Revenue identifies itself in public materials as the state tax agency but, in the accessible extract in this environment, does not provide specific numeric tax rates or detailed descriptions of the state tax structure. The visible text consists of a heading identifying the agency, without listing personal income tax rates, corporate tax rates, sales tax rates, property tax rates, or severance tax rates.
It is widely reported in other contexts that Wyoming's tax system relies heavily on taxes tied to mineral and energy production and that the state does not levy a broad based personal income tax, but the accessible Department of Revenue text here does not confirm those details. Because this review requires that quantitative claims map to specific public datasets and avoids relying on unverified external summaries, this section does not state numeric statewide or local tax rates, and no official public numeric rate is available on those points in this environment.
What can be stated confidently is that Wyoming has a functioning Department of Revenue that administers state tax laws and works with county officials on property tax administration. Property taxes on real estate are determined at the county level within a statewide legal framework and form an important part of the operating expense profile for properties in Wyoming. However, without numeric rates or effective tax burden statistics, investors must obtain property specific tax data from county assessors, treasurers, and professional tax advisors when underwriting deals in the state.
For accredited investors, the practical implication is that potential tax advantages or disadvantages of Wyoming real estate cannot be quantified in this review and must be assessed using up to date statutory materials and professional advice outside this environment.
Section 13Insurance
The Wyoming Department of Insurance is the primary public authority overseeing insurance markets in the state. In its public mission statement, the department explains that its role is to enforce the insurance laws and regulations of Wyoming impartially, honestly, and expeditiously, to serve the consumer of insurance, to encourage a healthy insurance marketplace, and to promote changes that better serve the public interest. The department emphasizes that it aims to exercise the highest ethical, professional, and work quality standards in its interactions with individuals, agencies, and companies and aspires to be among the best insurance regulatory agencies in the United States.
Recent public communications illustrate the department's oversight function. The department has, for example, publicized its intervention in an insurer telematics billing matter in which a driving behavior tracking product incorrectly reported certain events for a number of Wyoming customers, leading to some customers being charged higher premiums than warranted and the company issuing refunds. This kind of episode shows that the department monitors insurer practices and intervenes when billing issues arise, which is relevant for property owners and tenants concerned about fair insurance pricing.
However, the Department of Insurance site does not provide statewide numeric averages or ranges for homeowners or commercial property insurance premiums in the accessible text. There are no public tables here for average premiums per policy, claim rates, or loss ratios by geography or peril. Consequently, this review cannot quantify typical insurance costs for residential or commercial properties in Wyoming or compare them to national averages, and no official public numeric premium figure is available on those points in this environment.
For real estate investors, this means that insurance expenses must be assessed on a property by property basis, drawing on quotes from insurers or brokers and reflecting the specific hazards a property faces, such as wind, hail, snow and ice, wildfire, or flood risk. The presence of an active state insurance regulator is a positive factor for market oversight, but it does not substitute for detailed underwriting of insurance coverage and costs at the asset level.
Section 14Landlord Tenant and Regulatory Environment
Wyoming's landlord tenant framework is established by state statutes that govern leases, security deposits, habitability, and eviction procedures, but in this environment there is no single public document accessible that comprehensively summarizes these rules in consumer facing language, comparable to the landlord tenant guides provided in some other states. Public materials visible here from state agencies focus more on tax and insurance administration than on landlord tenant law.
Because of this, this review does not quote specific statutory sections, does not describe exact notice periods required for nonpayment or other lease violations, and does not outline particular requirements for security deposit handling, habitability standards, or repair obligations. Nor does it detail any state level tenant protection measures that may apply in certain situations.
At the same time, there is no indication in accessible public materials that Wyoming has instituted a statewide rent control regime that caps rent levels or annual rent increases for private rental properties. Residential rents appear to be set primarily by contract between landlords and tenants within the bounds of fair housing and consumer protection laws, and eviction actions for nonpayment or other breaches proceed through county level courts.
For investors, the qualitative picture is of a landlord tenant environment that is generally more favorable to property owners than in some more heavily regulated states, but where the exact rules vary by jurisdiction and require local legal expertise. Before investing in multifamily or single family rentals in Wyoming, it is prudent to review state landlord tenant statutes and consult Wyoming counsel to understand procedures, timelines, and risks associated with leasing and enforcement.
Section 15Infrastructure
Wyoming's infrastructure underpins both its resource driven economy and its real estate markets. While this review does not have numeric data on road mileage, rail tonnage, or utility capacities, some structural features can be described qualitatively.
The state's highway network connects its cities and towns across a large geographic area with a small population base, supporting freight movement for energy and mineral extraction, agriculture, and general commerce. Interstates and major state routes link Wyoming communities to regional hubs in neighboring states, facilitating commuter flows, tourism, and supply chains. Rail lines support coal and other bulk commodity shipments, which are central to the state's mining and energy sectors.
Utilities, including electric power, natural gas, water, wastewater, and telecommunications, serve dispersed communities and industrial sites. Many energy projects are tied into regional power networks, and new industrial and logistics developments often require careful coordination with utility providers to ensure sufficient capacity.
Airports in cities such as Cheyenne, Casper, and Jackson enable passenger travel and, in some cases, cargo operations, supporting both tourism and business travel. The presence of national parks and recreation areas also shapes infrastructure investments in access roads, visitor facilities, and emergency services.
For real estate investors, the critical infrastructure questions in Wyoming relate less to sheer capacity and more to location specific access and resilience. In evaluating a property, investors should consider proximity to major highways, availability and reliability of utilities, particularly for industrial and logistics projects, and the adequacy of local civic infrastructure such as schools and healthcare facilities that affect residential demand.
Section 16Climate and Physical Risks
Wyoming's climate and physical risk profile combines elements of high plains and mountain environments, including cold winters with snow and ice, strong winds, thunderstorms, hail, and localized flood risks. While this review does not have numeric climate statistics such as average temperatures or precipitation totals for Wyoming cities, public information from federal agencies characterizes the broader risk landscape.
The Federal Emergency Management Agency explains that floods occur naturally and can happen almost anywhere, not only near rivers and coasts. FEMA notes that flood maps show the likelihood of flooding and that any area with at least a one percent chance of experiencing a flood in a given year is considered high risk. Areas in this category have at least a one in four chance of flooding during a thirty year mortgage term. FEMA emphasizes that floods do not follow city limits or property lines and that even areas outside designated high risk zones can experience flooding due to heavy rains, poor drainage, or nearby construction.
The National Centers for Environmental Information maintains one of the world's most significant archives of environmental data and provides access to climate, coastal, oceanographic, and geophysical data, which include long term records of temperature, precipitation, storms, and other hazards. Although this review does not extract Wyoming specific numbers from those archives, the existence of such data underscores that climate risks are well documented, even if not summarized here.
For Wyoming real estate, relevant physical risks include flood exposure along rivers and in low lying areas, snow and ice loading on roofs and infrastructure, high winds that can affect structural and envelope performance, and potential wildfire risk in certain forested or grassland regions. These hazards can influence both the physical durability of properties and the cost and availability of insurance.
Investors should integrate climate and hazard assessments into due diligence by reviewing FEMA flood maps for property locations, consulting local experience with storms and snow loads, and ensuring that building designs and maintenance practices reflect the local climate. Properties that incorporate resilient design features and have clear mitigation plans may command a premium in risk adjusted returns.
Section 17Opportunities
Several opportunity themes emerge for accredited investors considering Wyoming real estate under the constraints of available public data.
First, the statewide housing metrics show a market with median sale prices somewhat below national medians, modest recent price appreciation, slightly tighter inventory, and very limited above list bidding. A median sale price of 378,655 dollars and a 1.0 percent year over year price increase, combined with a 1.2 percent decline in inventory and only 5.3 percent of homes selling above list in May 2026, suggest that disciplined buyers can acquire residential assets without competing in intense bidding wars. This can be favorable for investors seeking yield and disciplined basis control.
Second, the labor market data indicate a small but stable economy that has shifted into positive year over year job growth by mid 2026, with total nonfarm employment higher in June than a year earlier and unemployment around 3.2 percent. Low unemployment supports residential occupancy and consumer spending. For multifamily and single family rentals, this backdrop can underpin steady cash flows, particularly in communities linked to resilient sectors such as government, education, healthcare, and essential retail.
Third, the presence of more than 5,000 affordable rental units developed through programs administered by the Wyoming Community Development Authority points to an established framework for public private collaboration in multifamily development. Investors with experience in Low Income Housing Tax Credit or other subsidized frameworks may find opportunities to partner on new or rehabilitated affordable projects, especially in communities with documented housing needs.
Fourth, Wyoming's energy and resource orientation creates demand for industrial and logistics properties that support extraction, processing, and distribution activities. Facilities that serve these sectors can benefit from long term contracts and tenant relationships, though they also carry commodity cycle exposure.
Finally, the state's tourism assets, including national parks and outdoor recreation, support hospitality and short term rental opportunities in specific markets. While this review does not quantify visitor numbers, the prominence of tourism in Wyoming's identity suggests that well located lodging and mixed use assets in gateway communities can capture durable demand.
Section 18Risks
The same features that create opportunity in Wyoming also introduce risks that investors must weigh carefully.
A first risk is the limited transparency of public data. The inability to access official population, income, rent, vacancy, and transaction statistics means that investors cannot cross check underwriting assumptions against broad based state and metro benchmarks. This increases reliance on property level data and proprietary sources, raising the stakes for due diligence and potentially widening the range of plausible outcomes.
A second risk is sector concentration. The Bureau of Labor Statistics data show that mining and logging employment remains a significant employer in Wyoming, with 15.4 thousand jobs in May and preliminary June 2026, even though twelve month changes in that sector have been negative over the past year. A sustained downturn in energy prices, regulatory changes, or shifts in market demand could weaken employment and incomes in affected communities, with knock on effects on housing and commercial real estate demand.
Third, Wyoming's small absolute employment base, under 300 thousand nonfarm jobs statewide, means that large projects or employer decisions can have outsized local impacts. A closure or expansion of a major facility in a small city can significantly affect occupancy, rents, and asset values in that market, more so than in diversified large metros.
Fourth, capital markets risk is higher in small and secondary markets. In tighter credit environments, lenders and investors may reallocate capital toward larger, more liquid markets, leaving Wyoming assets facing higher cap rates, lower leverage, or longer marketing times. Exit liquidity can be thin, especially for specialized assets or properties in remote locations.
Finally, climate and hazard risks, including floods, snow and ice, wind, and wildfire, can lead to property damage, operational disruptions, and rising insurance costs. Without statewide average insurance data, investors must assume that premiums could increase in response to events or re underwriting and should stress test financial models accordingly.
Section 19Investor Implications
For accredited investors, Wyoming should be approached as a niche allocation within a diversified portfolio, offering exposure to a resource influenced, low unemployment state with moderate residential price growth and relatively low bidding intensity in housing markets. The Bureau of Labor Statistics data show a labor market that has stabilized and returned to modest growth, while Redfin housing metrics highlight a state where buyers and sellers transact at prices close to list with only modest year over year gains.
Within this context, multifamily and single family rental investments in Wyoming may provide steady income streams, particularly in communities with diversified employment bases and constrained new supply. Affordable housing investments benefiting from programs administered by the Wyoming Community Development Authority can offer structured returns with public support, though they require specialized expertise.
At the same time, investors must recognize and manage the risks associated with limited public data, sector concentration, small market size, and climate hazards. Underwriting must be grounded in detailed property level information, conservative assumptions, and scenario analysis rather than in broad market averages that are not available here.
Capital allocation decisions should consider the role Wyoming assets play in the overall portfolio, whether as yield oriented, small market complements to holdings in larger, more liquid metros, as targeted plays on energy, logistics, or tourism, or as strategic affordable housing investments. Position sizing, leverage, and exit planning should reflect the state's liquidity and information characteristics.
Section 20Conclusion
Wyoming's statewide real estate and multifamily market in 2026 is characterized by a small but stable labor market, modest positive job growth, and housing prices that sit somewhat below national medians with limited bidding intensity. The Bureau of Labor Statistics data show unemployment in the low single digits and improving twelve month job growth, while Redfin reports a median home price of 378,655 dollars, a 1.0 percent annual price increase, slightly declining inventory, and only 5.3 percent of homes selling above list price as of May 2026.
Affordable housing infrastructure is reinforced by more than 5,000 units of affordable rental housing funded through federal programs administered by the Wyoming Community Development Authority. At the same time, public numeric data on population, income, rents, vacancy, and cap rates are not accessible in this environment, requiring investors to lean on property level evidence and proprietary sources.
For accredited investors, Wyoming offers the potential for balanced risk adjusted returns in multifamily, single family, industrial, and selected retail or hospitality assets, particularly where projects are aligned with stable employment anchors and conservative underwriting. The state's small size and data limitations demand more effort in research and due diligence, but for investors willing to engage at that level, Wyoming can play a distinct role in a diversified real estate portfolio.
Sources
- United States Bureau of Labor Statistics, Wyoming Economy at a Glance, statewide seasonally adjusted civilian labor force, employment, unemployment, unemployment rate, total nonfarm employment, mining and logging employment, construction employment, and twelve month percent changes for January through June 2026; data viewed August 7, 2026.
- Redfin, Wyoming Housing Market: House Prices and Trends, statewide median sale price across all home types of 378,655 dollars with a 1.0 percent year over year increase in May 2026, 3,024 homes for sale with a 1.2 percent year over year decrease in May 2026, and 5.3 percent of homes sold above list price with a 1.0 percentage point year over year decrease in May 2026, plus list of the top ten most competitive cities in Wyoming; data viewed August 7, 2026.
- Redfin, United States Housing Market and Prices, national median sale price across all home types of 398,771 dollars with a 2.0 percent year over year increase in May 2026, 1,483,839 homes for sale with a 0.7 percent year over year increase in May 2026, and 24.9 percent of homes sold above list price with a 0.083 percentage point year over year decrease in May 2026, plus national migration statistics for January through March 2026; data viewed August 7, 2026.
- United States Census Bureau, QuickFacts Wyoming table, which in this environment returned a Cloudflare security page stating that access to www.census.gov is blocked, preventing retrieval of population and income data; page viewed August 7, 2026.
- United States Department of Housing and Urban Development, fiscal year 2024 Fair Market Rents documentation system select geography interface, which in this environment displays only prompts to select state, county, or metropolitan areas without exposing numeric rent values; viewed August 7, 2026.
- Wyoming Community Development Authority, main page describing the authority as the state's leading resource for housing finance, summarizing its provision of low interest single family mortgages, down payment assistance, home buyer education, and administration of the Low Income Housing Tax Credit, National Housing Trust Fund, and HOME Investment Partnerships programs, and stating that these programs have funded more than 5,000 units of affordable rental housing across Wyoming; viewed August 7, 2026.
- Wyoming Department of Revenue, main page identifying the state tax agency without providing numeric statewide tax rate information in the accessible extract; viewed August 7, 2026.
- Wyoming Department of Insurance, home page including the department's mission statement regarding enforcement of insurance laws and consumer service, and a public communication describing its intervention in an insurer telematics billing matter affecting Wyoming customers; viewed August 7, 2026.
- Federal Emergency Management Agency, Flood Maps page explaining that floods can occur almost anywhere, that flood maps show the likelihood of flooding, that any area with at least a one percent annual chance of flooding has at least a one in four chance of flooding during a thirty year mortgage, and that floods do not follow city limits or property lines; viewed August 7, 2026.
- National Centers for Environmental Information, main page describing the agency as maintaining one of the most significant archives of environmental data and providing access to climate, coastal, oceanographic, and geophysical data; viewed August 7, 2026.